Excel Templates
Description
This page contains downloadable templates that users of cmdtyView for Excel can use to create stunning visualizations that leverage all of the data in our ecosystem. We are continuously adding to this repository, so please check for updates.
Templates
| Template | Description | File Download | Other | Preview |
|---|---|---|---|---|
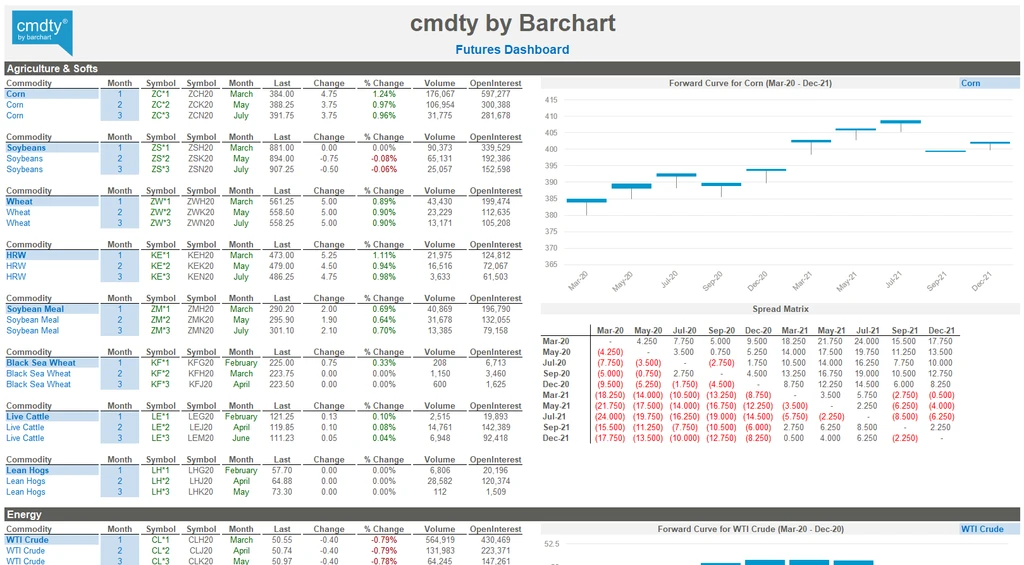
| Futures Market Dashboard | Here it is. Our simple, but extremely popular template, to keep an eye on futures markets. Just select the product of your choice and the most active contracts will start streaming right into your dashboard. View multiple products at a time and get a view of the current forward curve - which streams updates directly into the chart. | Next Gen cmdtyView Excel - Futures Dashboard (xlsx) | Commodities Covered
|
 |
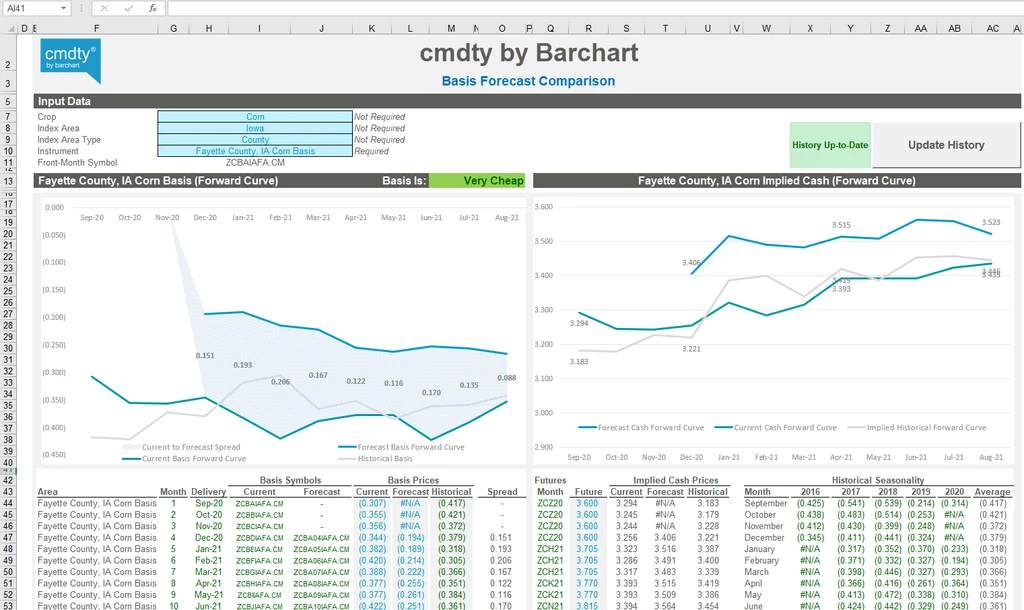
| Basis Forecast vs. Forward Curve | Our basis forecasts simplify how you price bids and market grain more effectively with 9,000+ localized basis forecasts that outperform your current forward curve Grain Merchandiser? Set your curve more easily with forecasts that combine historical seasonality and current spot pricing to generate a forward curve that more effectively predicts future spot basis. Grain Marketer? Improve your grain marketing strategies to grow your business and help your clients. Quickly identify mispriced basis opportunities and position your portfolios accordingly. | cmdtyView Excel - Basis Forecast Comparison (xlsx) | Commodities Covered
|
 |
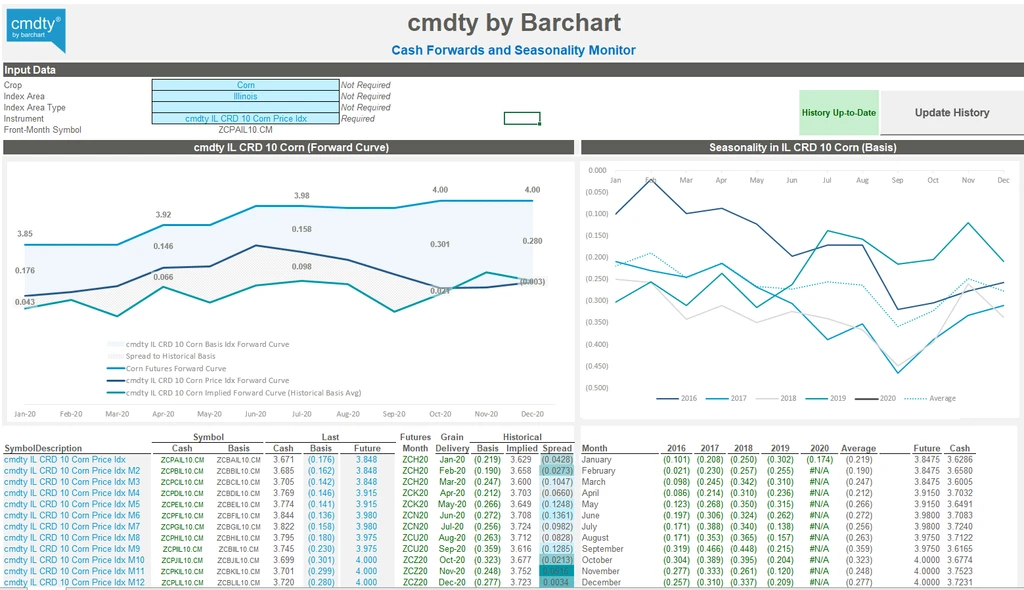
| Cash Forward and Basis Seasonality Monitor | Users of this workbook are able to perform powerful analysis of historical basis trends for any relevant growing area within the United States. We provide users with a pre-built template to chart current cash forward prices against historical averages to identify areas where grain is relative “lean” or “rich” in terms of basis pricing. Users can view year-by-year seasonality for the grain buying region of their choice and understand where the current year is tracking relative to historical patterns. Additionally, users can create forward models for the current year based on user-defined projections using historical basis patterns. Advanced users can create a custom historical average window to exclude “abnormal” growing conditions in years past. For the most ambitious users, the integration of yield forecast information and historical production data from cmdty Statistics is possible. | cmdtyView Excel - Cash Forward and Seasonality (xlsx) | Commodities Covered
|
 |
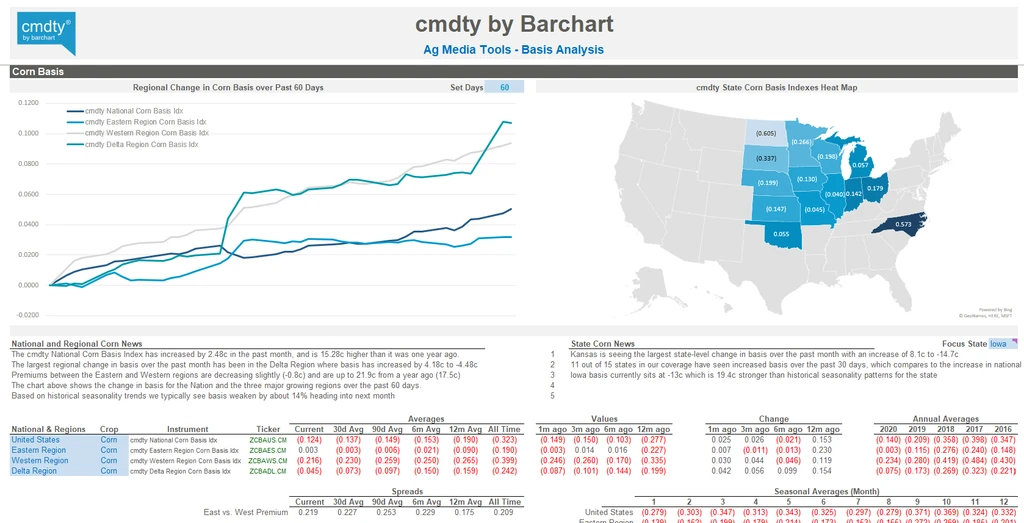
| Tools for Ag Media (Basis Analysis) | Writing about what’s going on in agriculture isn’t easy. We’re here to make it easier. We provide users with simple access to real-time basis values at the State, Region, and National level for corn and soybeans. Not only that, we’ve gone to the trouble of calculating historical averages, so understanding where current basis sits relative to seasonality patterns is as simple as opening-up the workbook. Here are examples of insights that our tool generates automatically for users:
|
cmdtyView Excel - Tools for Ag Media (Basis Analysis) (xlsx) | Commodities Covered
|
 |
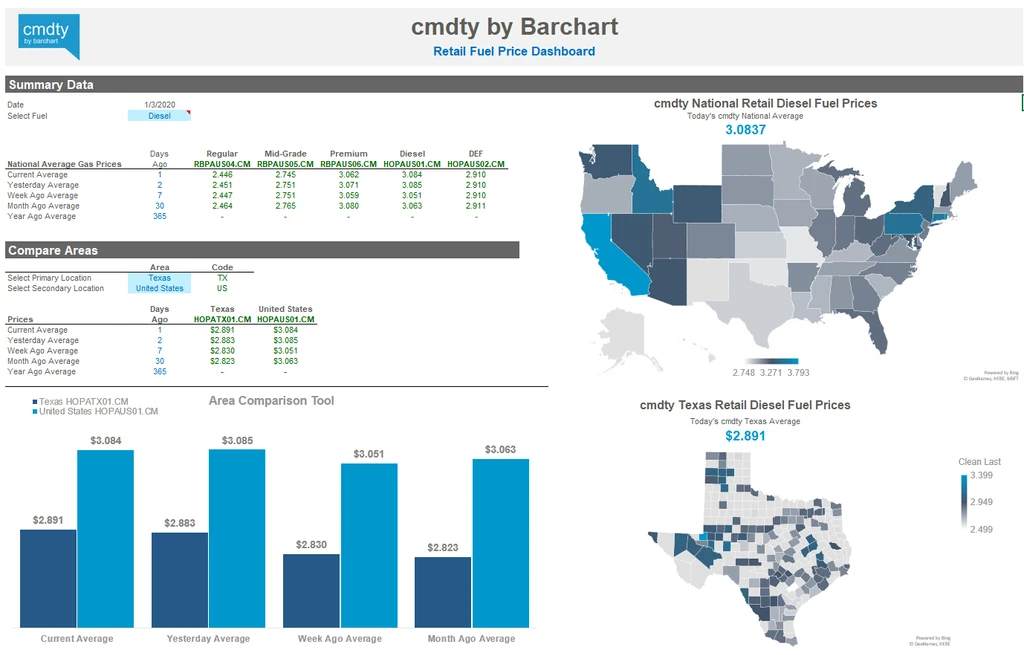
| US Retail Fuel Price Dashboard - Travel Centers | This workbook provides users with an in-depth overview of the US Retail Fuel Market with a focus on Travel Center pricing. We aggregate prices from all of the major travel centers throughout the United States, and provide users with county, CRD, state, PADD, and national averages for gasoline, ULSD, and DEF. Quickly understand trends in fuel prices throughout the country and identify where pricing outliers exist. This worksheet offers retailers, travel center operators, energy traders and investors detailed comparisons of price indexes. Advanced users may combine our index-level data with location specific pricing to create models to price their own location in real-time. | cmdtyView Excel - US Retail Fuel Prices (xlsx) | Commodities Covered
|
 |
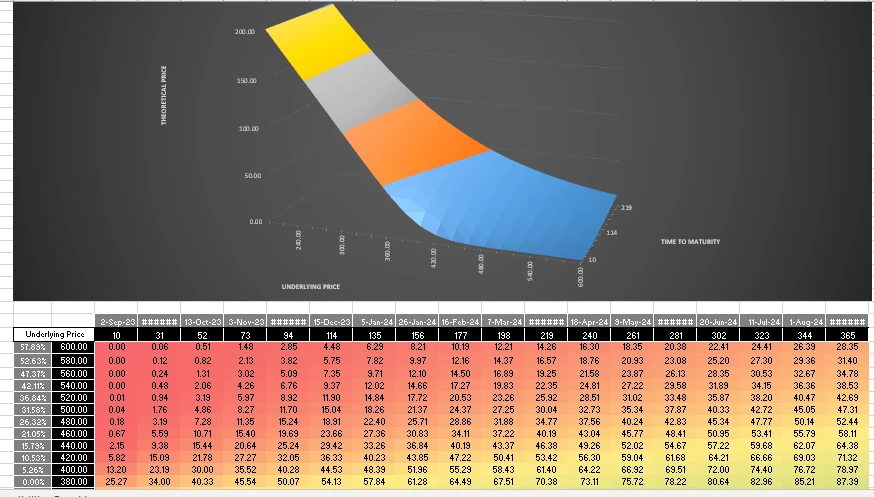
| Options Theoretical Calculator | Calculate an option’s theoretical price, delta, gamma, vega, theta and rho using the options theoretical calculator template. Once input parameters are set, plot any of the values against an underlying price and time to maturity. | cmdtyView Options Theoretical Calculator (xlsx) |
Commodities Covered
|
 |
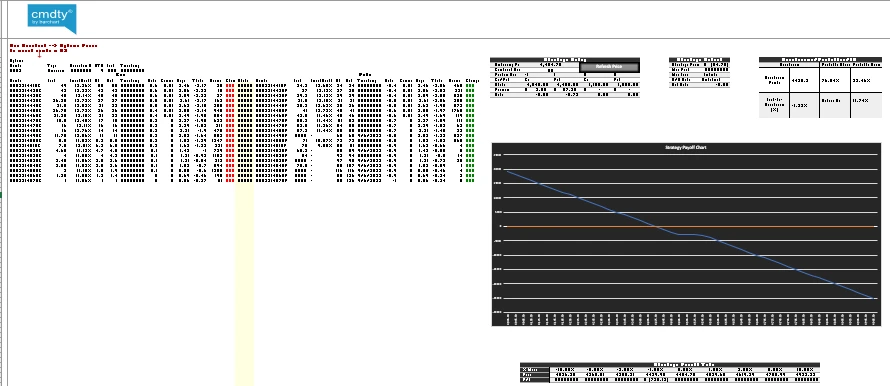
| Options Strategy Builder | Input underlying price, lot sizes, strikes and position to view the strategy’s cost, max profit and loss, risk reward ratio, net delta, break even levels and % change to the BE prices. Click on the refresh price to pull in the latest available price. | Options Strategy Builder cmdtyView complete(xlsx) | Commodities Covered
|
 |
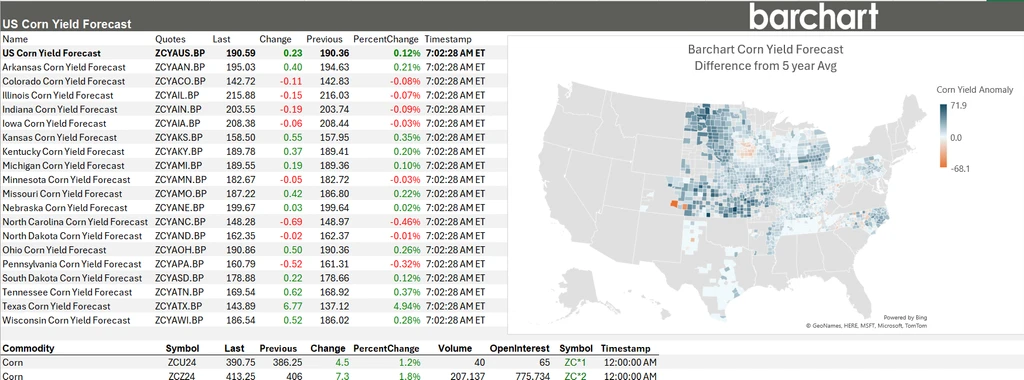
| Barchart US Corn Yield Forecast | Daily US, State, and County corn yield predictions from Barchart’s enhanced forecast model, now powered by Planet's advanced satellite data. | Barchart US Corn Yield Forecast Data.xlsx (xlsx) | Commodities Covered
|
 |
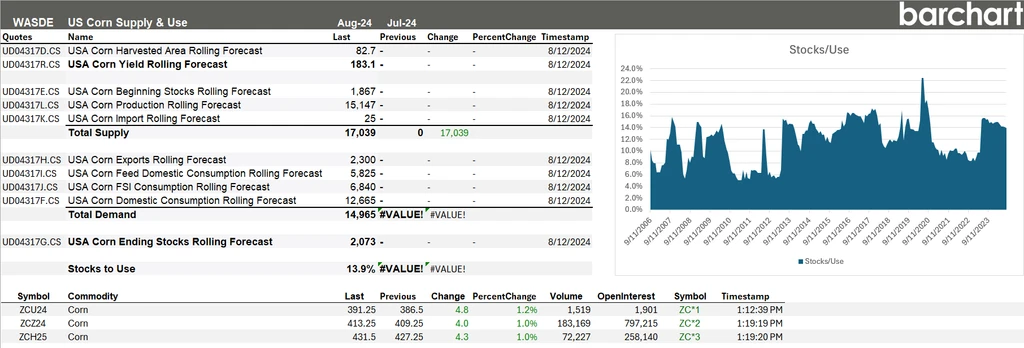
| WASDE - Corn Balance Sheet | USDA WASDE Report data for US Corn. Supply & Demand balance sheet along with an evolution of revisions. | WASDE Corn Balance Sheet (xlsx) | Commodities Covered
|
 |
| WASDE - Soybean Balance Sheet | USDA WASDE Report data for US Soybeans. Supply & Demand balance sheet along with an evolution of revisions. | WASDE Soybean Balance Sheet (xlsx) | Commodities Covered
|
 |
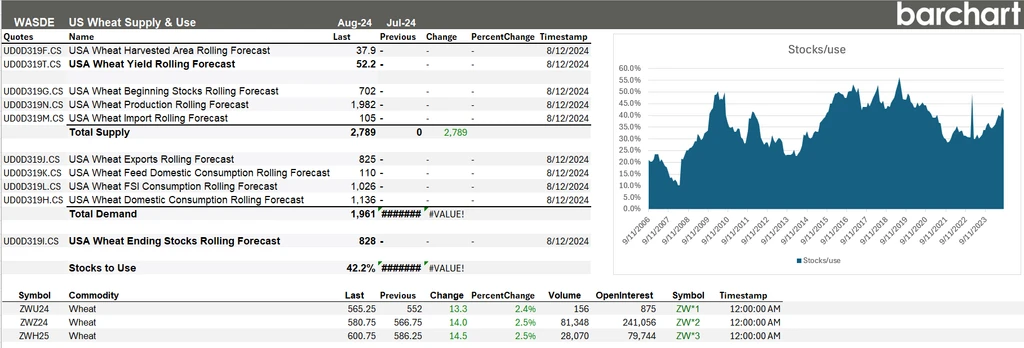
| WASDE - Wheat Balance Sheet | USDA WASDE Report data for US Wheat. Supply & Demand balance sheet along with an evolution of revisions. | WASDE Wheat Balance Sheet (xlsx) | Commodities Covered
|
 |
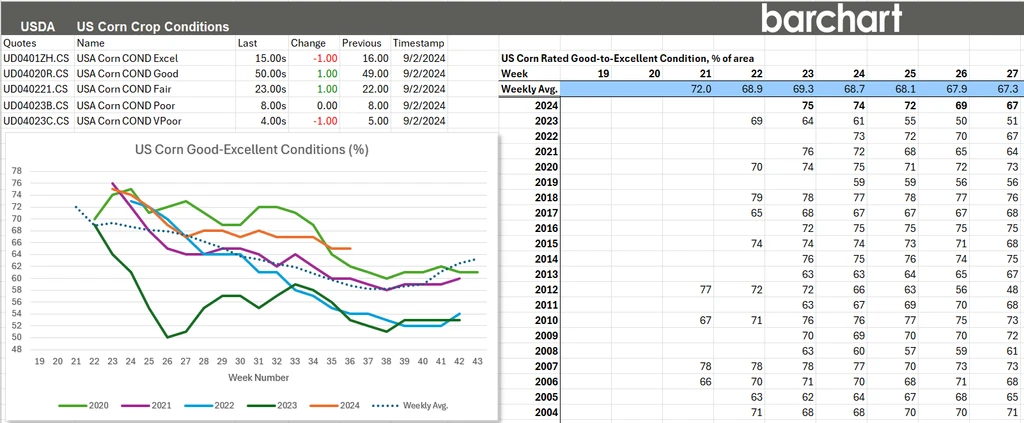
| USDA Corn Crop Conditions | USDA National and State corn conditions | US Corn Crop Conditions (xlsx) | Commodities Covered
|
 |
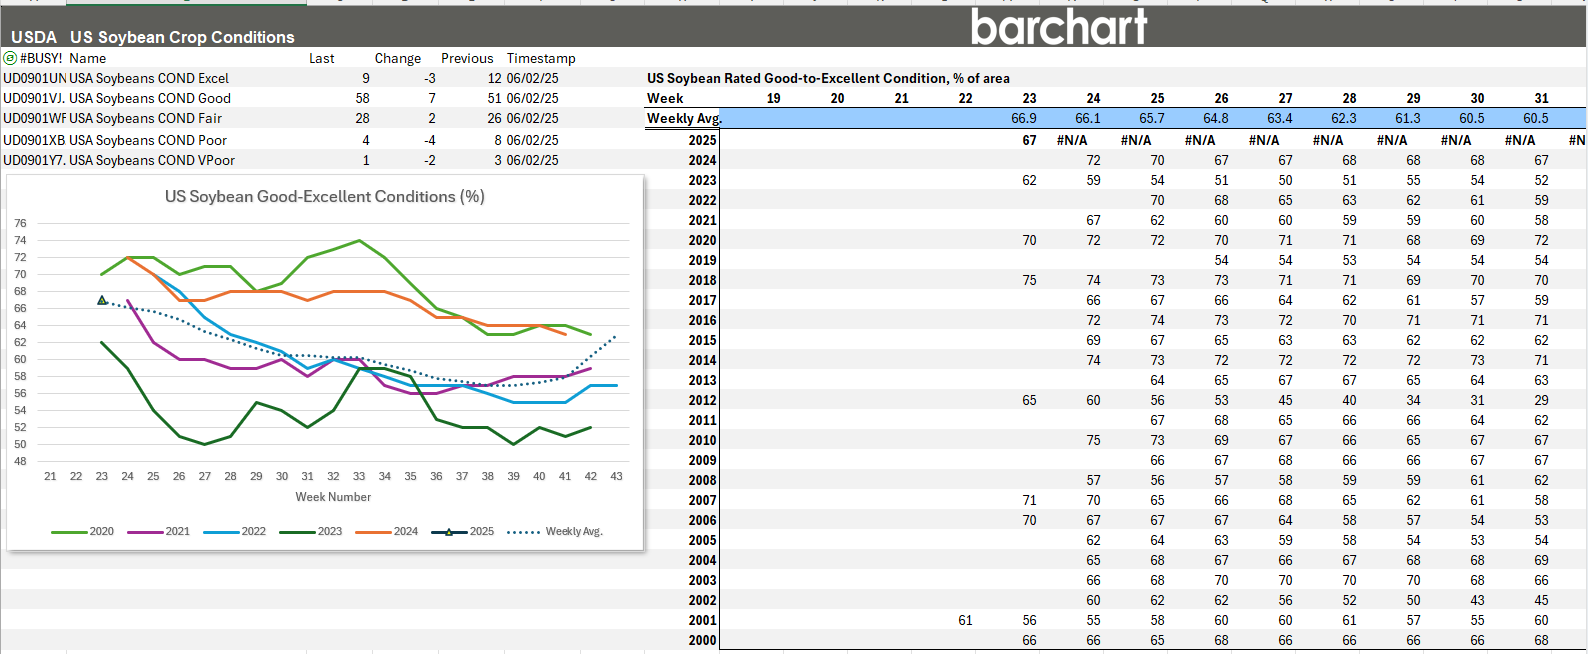
| USDA Soybean Crop Conditions | USDA National and State soybean conditions | US Corn Crop Conditions (xlsx) | Commodities Covered
|
 |
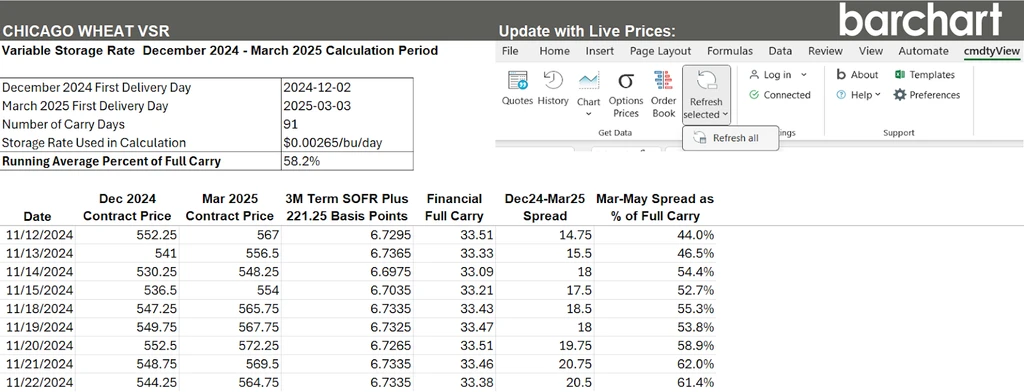
| Wheat VSR Calculator | Wheat Variable Storage Rate (VSR) Calculator
|
Barchart Wheat VSR Calulator 2025 (xlsx) | Commodities Covered
|
 |