History
Add a History Table
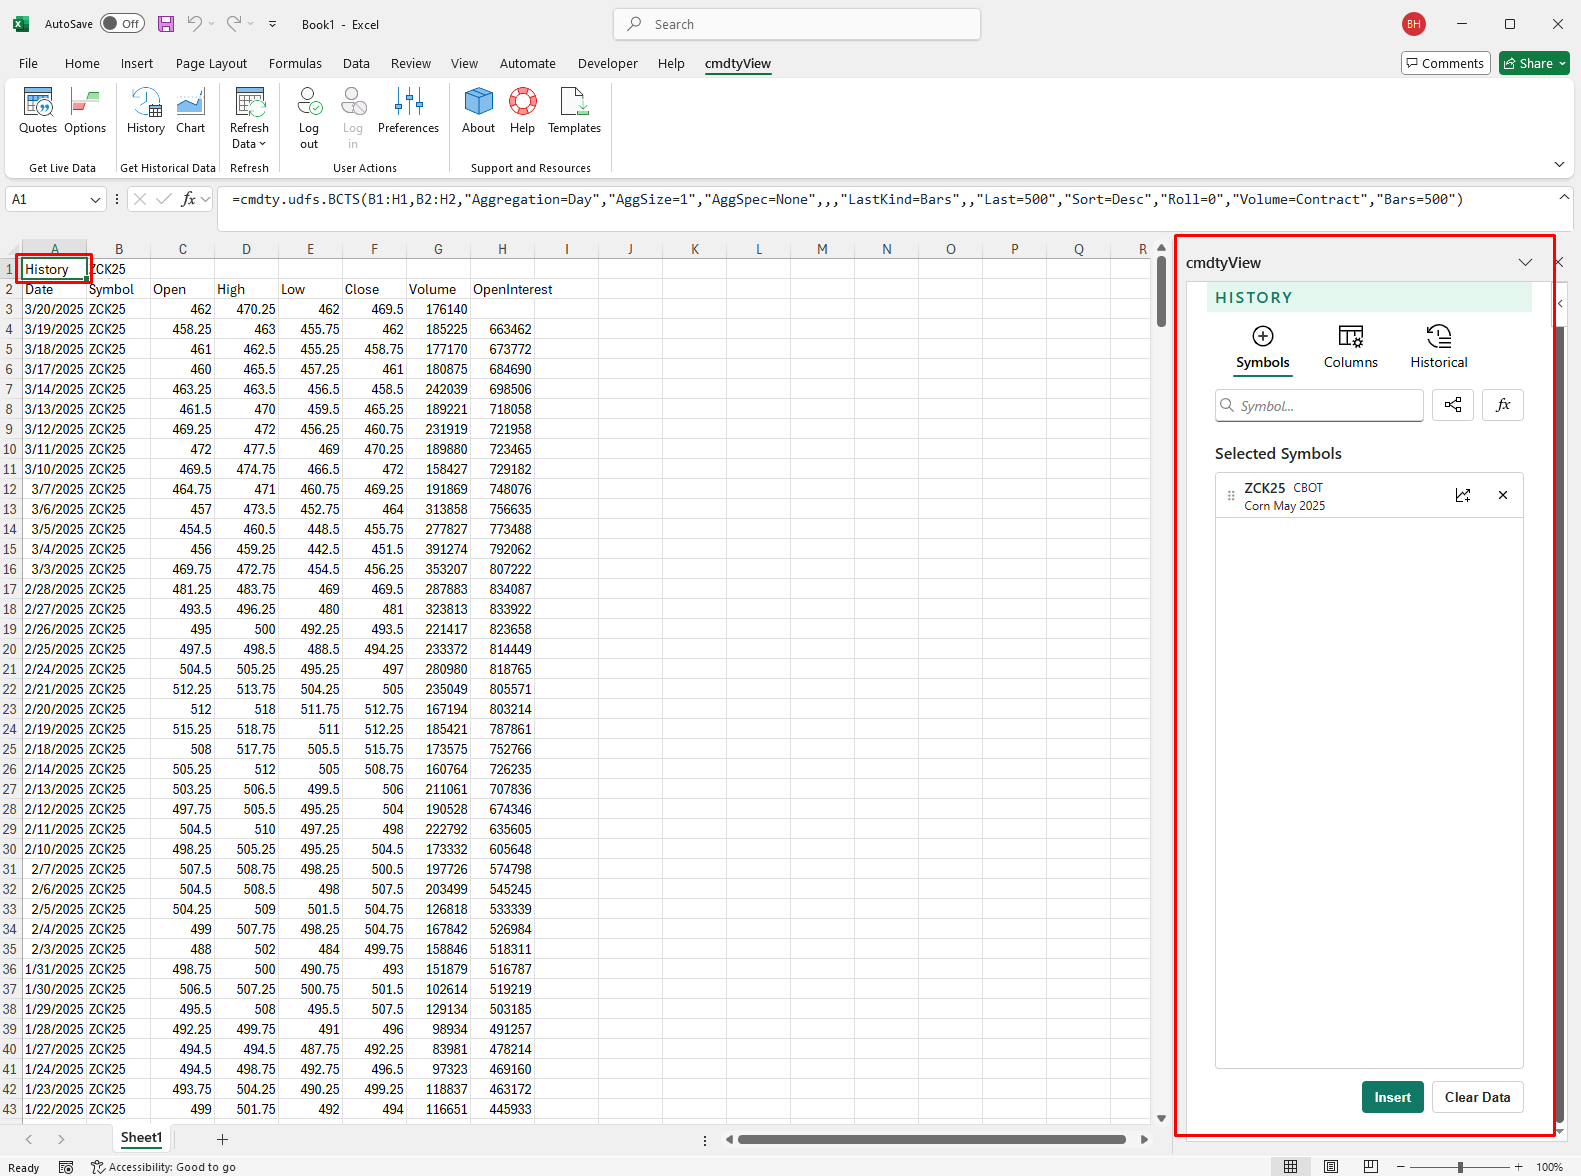
To insert a historica data table, Click on the History icon in the cmdtyView for Excel ribbon as shown below.
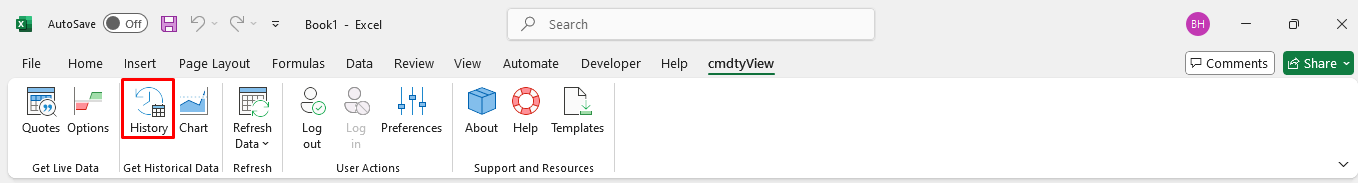
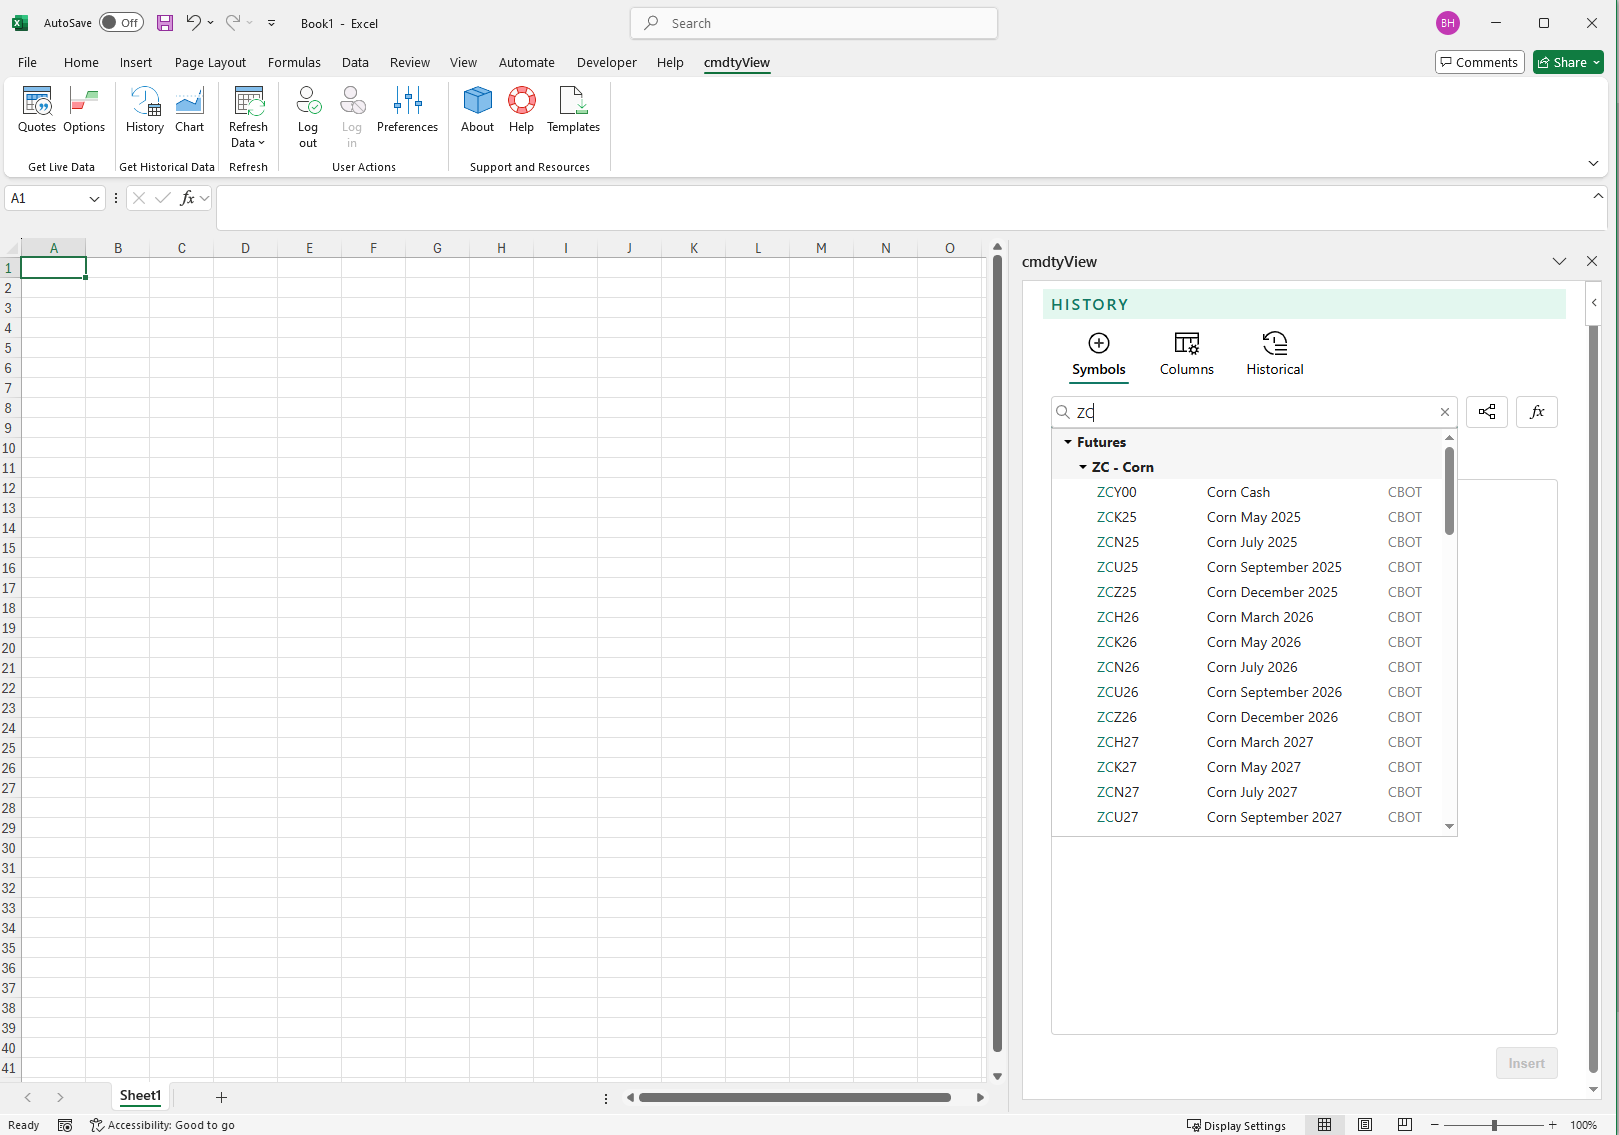
Use the insert History dialogue to search symbols by futures root, ticker or keywords. Click on the Symbol Tree Browser to search the cmdtyView data catalogue.
Select your Data Columns
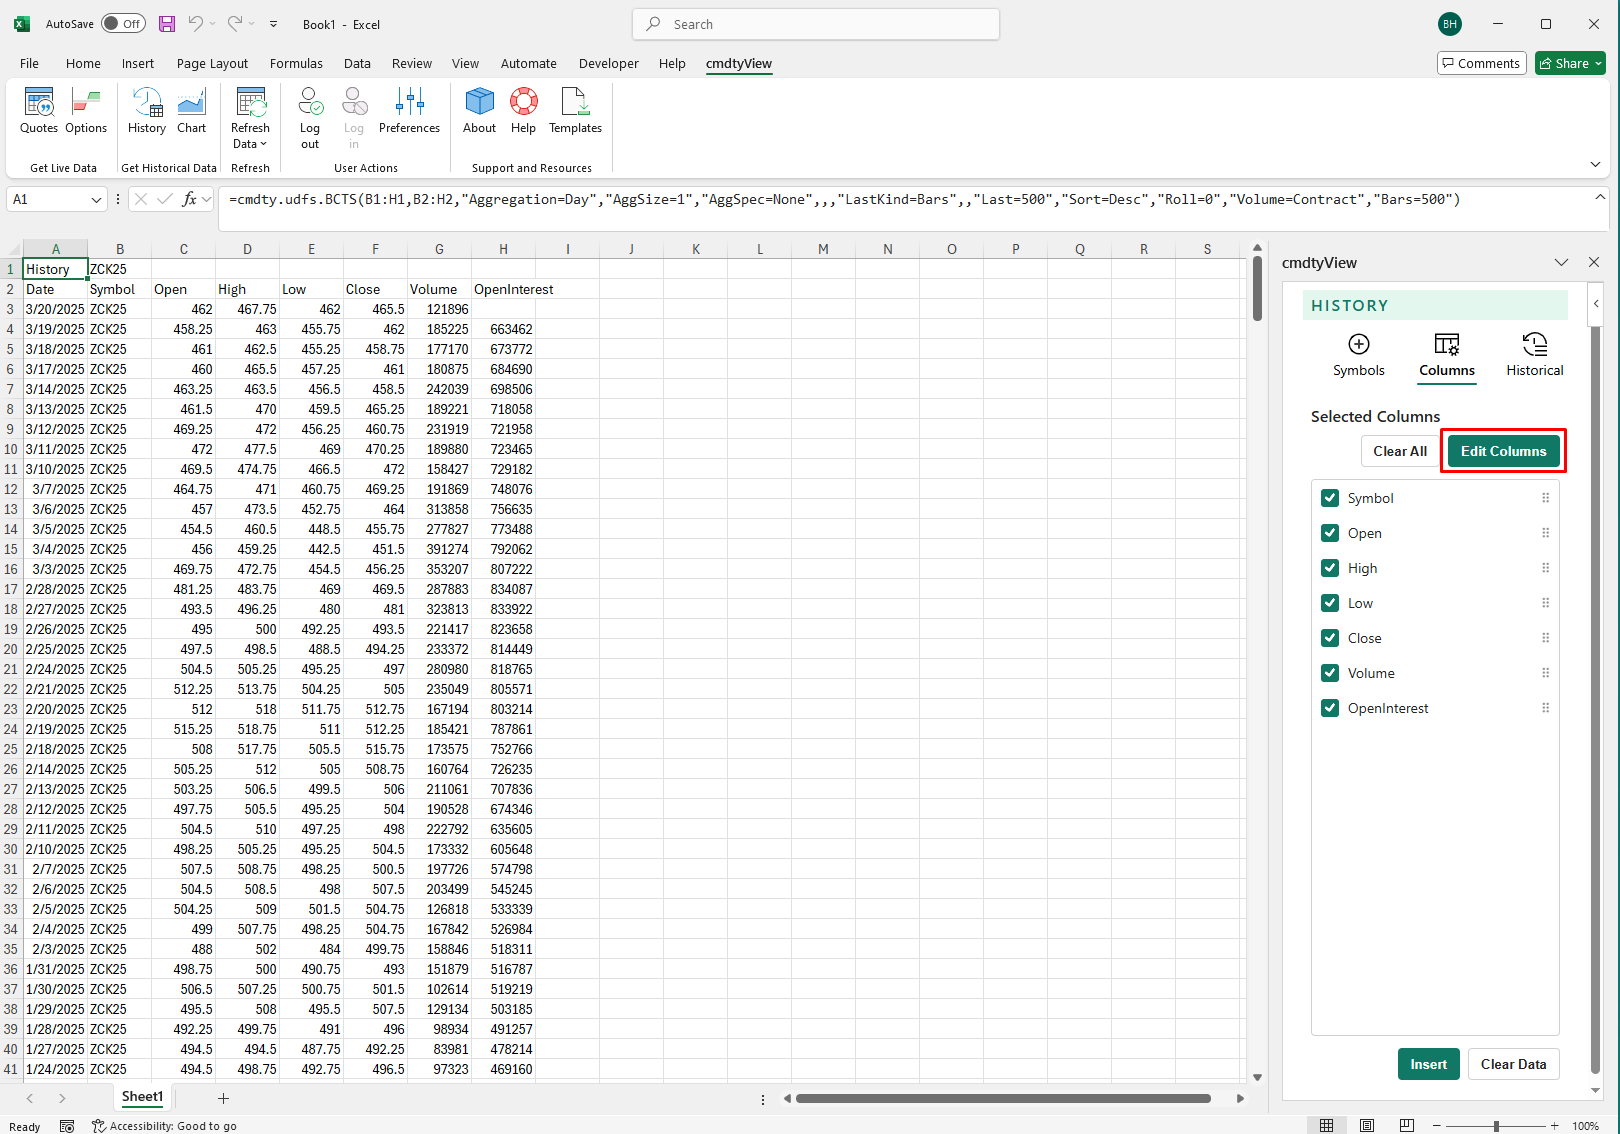
Select the columns or fields that you want to display in your historical data query by clicking on the Columns button in the History dialgoue.
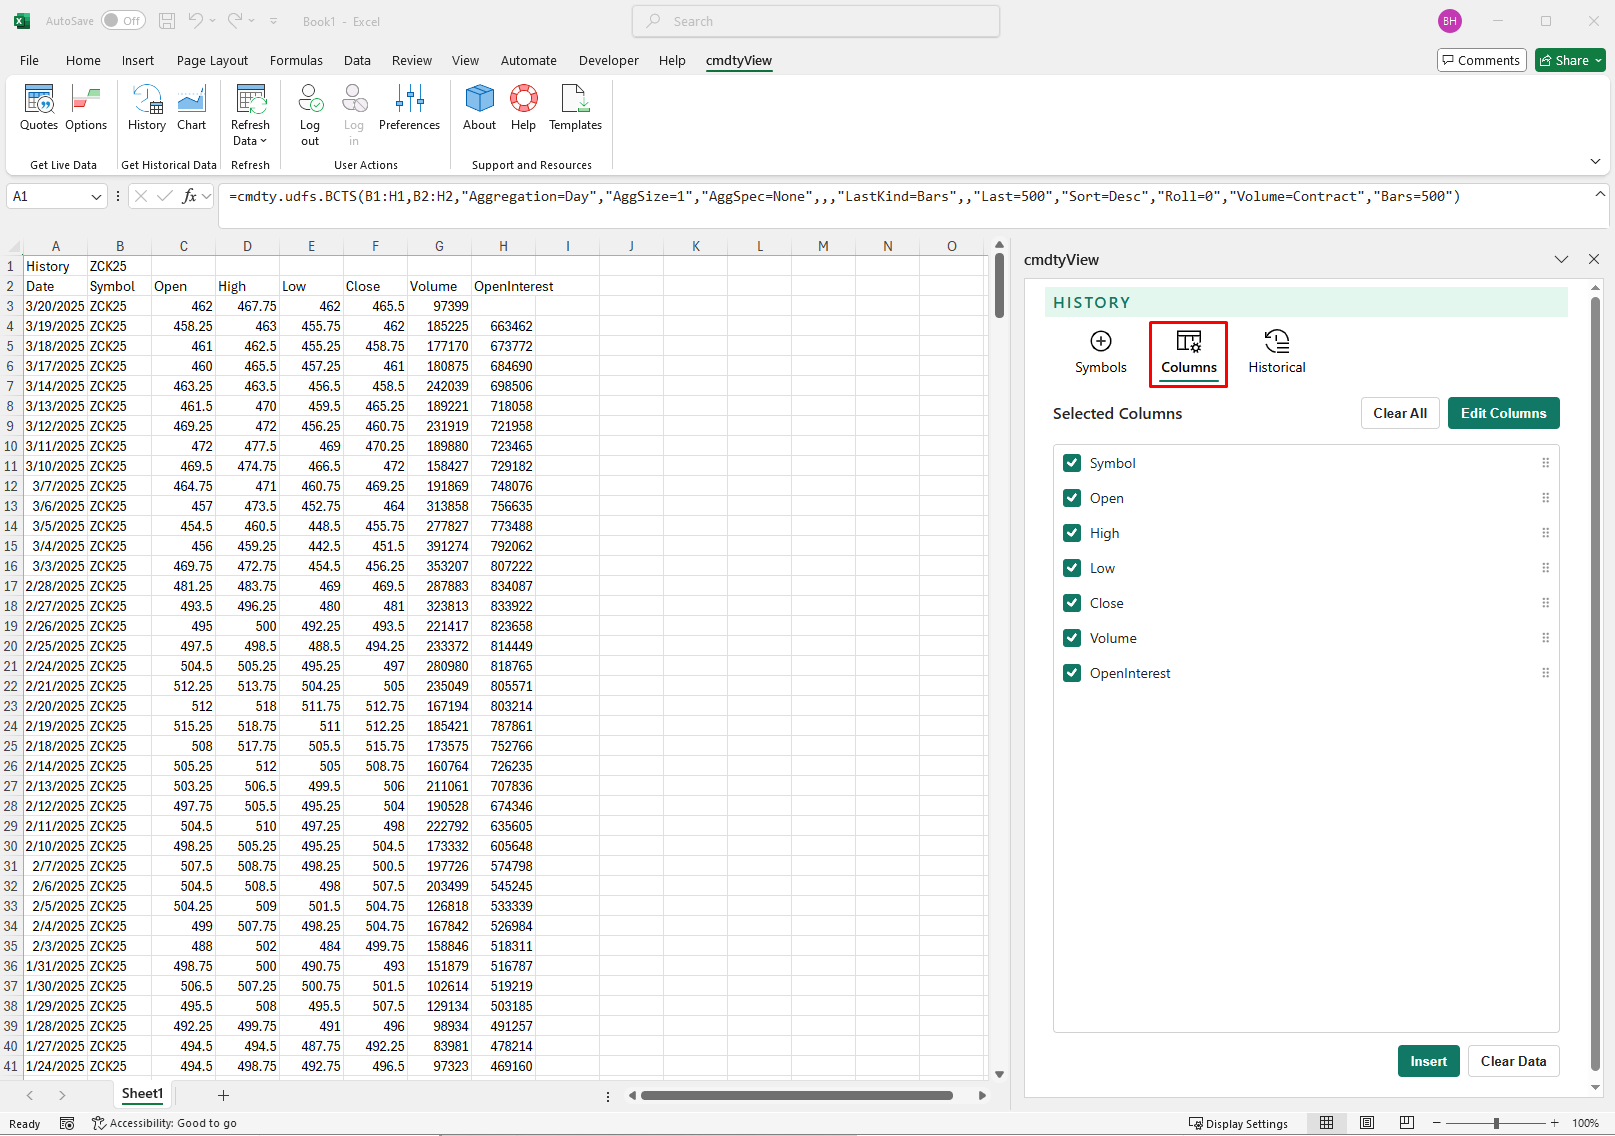
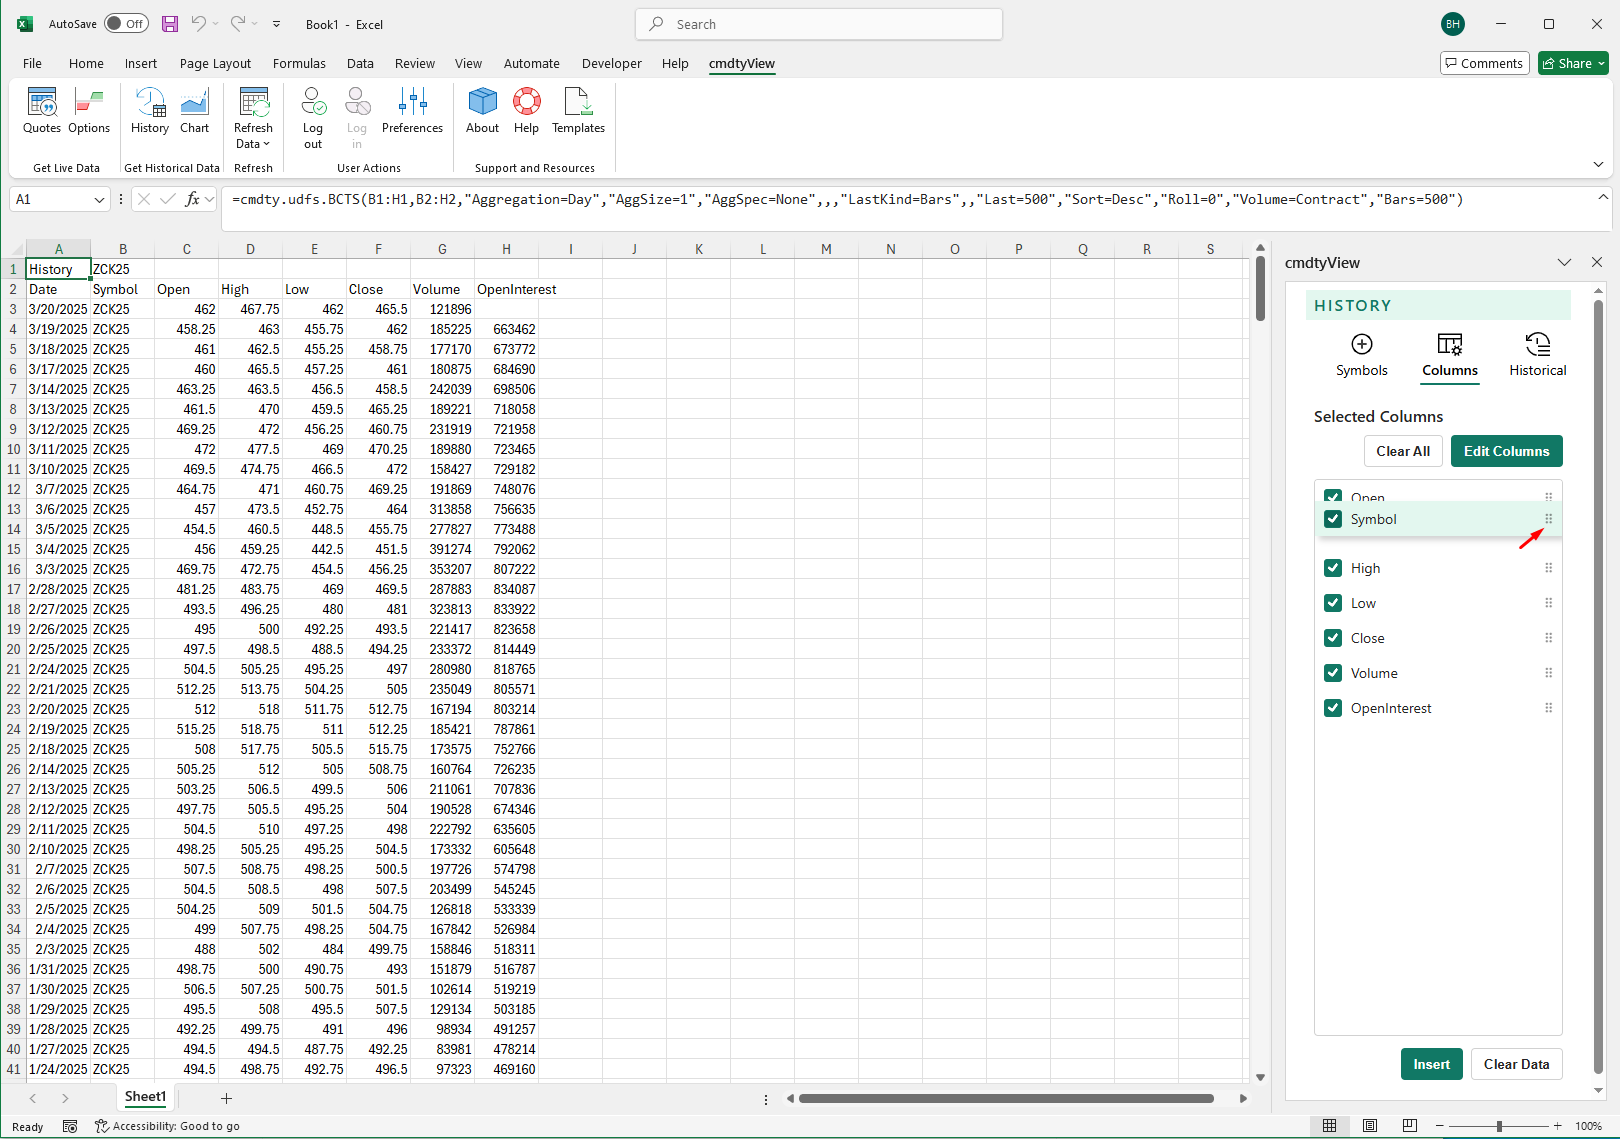
Reposition the fields by dragging and dropping them to their desired position in the Columns dialogue.
Columns Available
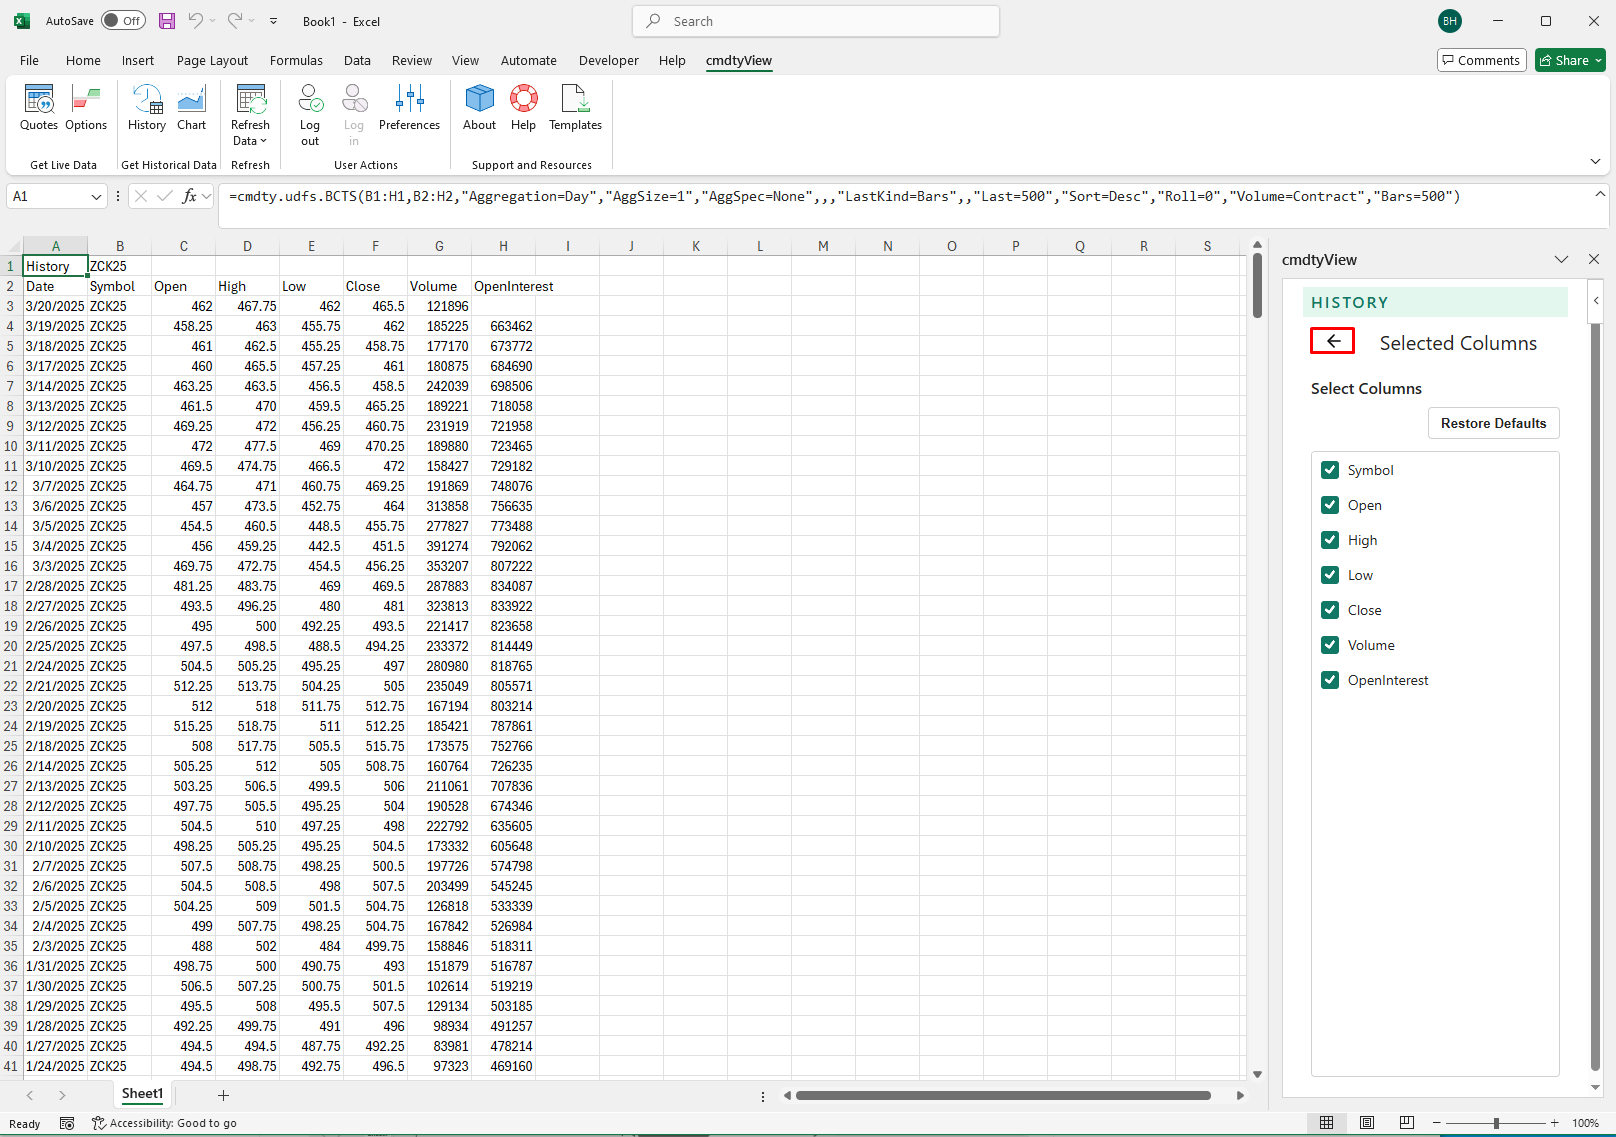
All available columns can be viewed by clicking on the Edit Columns button. Once the appropriate fields are selected, press the back arrow to return to the applied Columns view.
The table below includes all avalible fields that can applied to a Histoy data table:
| Field | Description |
|---|---|
| High | The highest price paid during the current trading session. |
| Last | The last price paid during the current trading session. |
| Low | The lowest price paid during the current trading session. |
| Open | The first price paid during the current trading session. |
| Open Interest | The total number of futures contracts traded that have not yet been liquidated either by an offsetting futures transaction or by delivery. |
| Symbol | The ticker symbol. |
| Volume | The total number of contracts traded during the current trading session. |
History Interval
History Interval / period
- The interval (sometimes referred to as the period) defines the amount of data represented by each data point. For example, selecting a Time aggregation of “15 minutes” results in a data table with a data point at every 15 minute interval.
Changing the aggregation
- Click the Interval drop-down list at the top of the Historical dialgoue to select your desired period
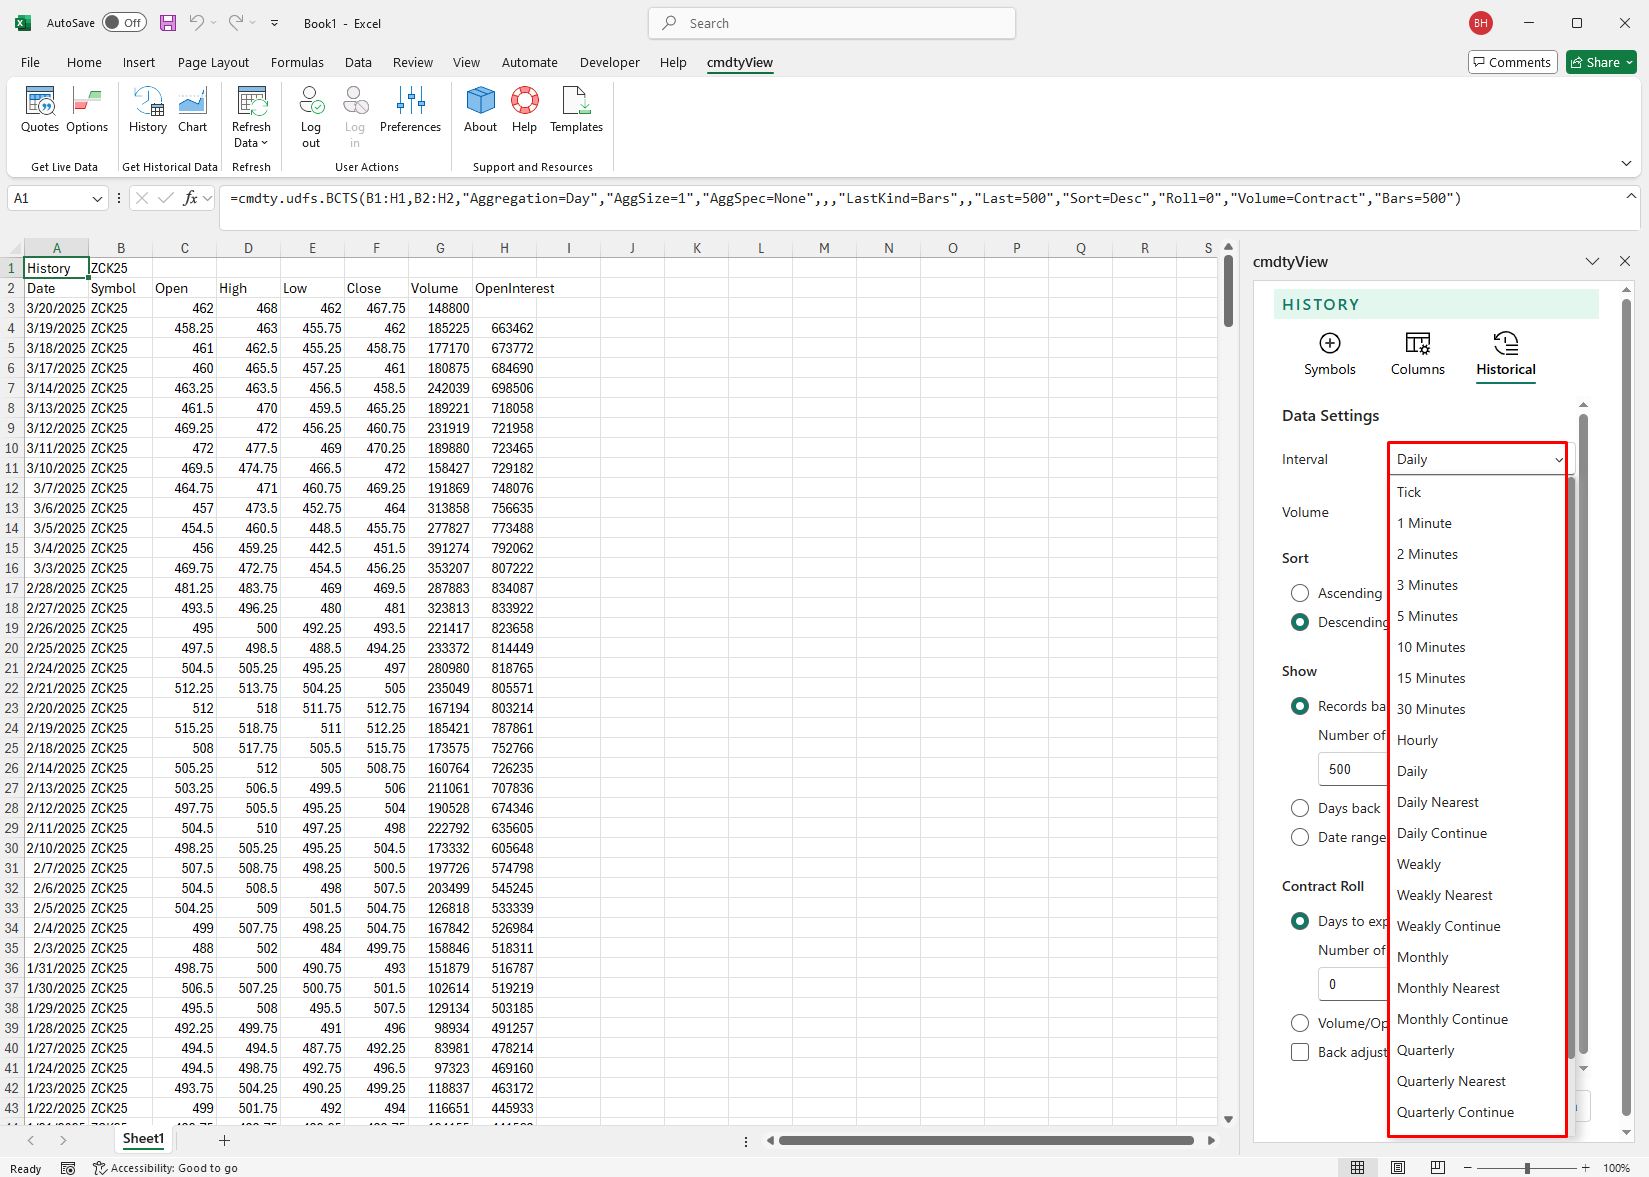
Available Aggregations
- For Intraday: Tick, 1 minute, 2 minute, 3 minute, 5 minute, 10 minute, 15 minute, 30 minute, and hourly.
- For Daily / Weekly / Monthly / Quarterly / Yearly: Shows the historical trading activity only for the contract specified.
- For Daily Nearest / Weekly Nearest / Monthly Nearest / Quarterly Nearest / Yearly Nearest: Builds a historical data table using the nearest contract. The nearest contract is the for the underlying commodity, where every chart bar represents the front month at that point in history.
For Daily Continue / Weekly Continue / Monthly Continue / Quarterly Continue / Yearly Continue: Builds a historical data table using the specified for the original contract. For example, if the symbol is ZSX25 (Soybeans November 2025), the data table is built using all previous November contracts for Soybeans (ZSX25, ZSX24, ZSX23, ZSX22 etc).
Volume
For futures, this parameter can be set to one of two values (contract volume and total volume) in order to specify whether the volume returned should be the contract volume or the total volume for all open contracts. For aggregates (such as weekly, monthly or yearly), this returns the average volume for the period specified.
Sort
This parameter can be set to one of two values (ascending and descending) in order to specify the chronological order of the resulting dataset returned.
Show
- Records Back: Returns the number of records between the most recent available date and the number of records requested.
- Days Back: If no end date is specified and a start date is specified, all the records between the start date and the most current available data will be returned.
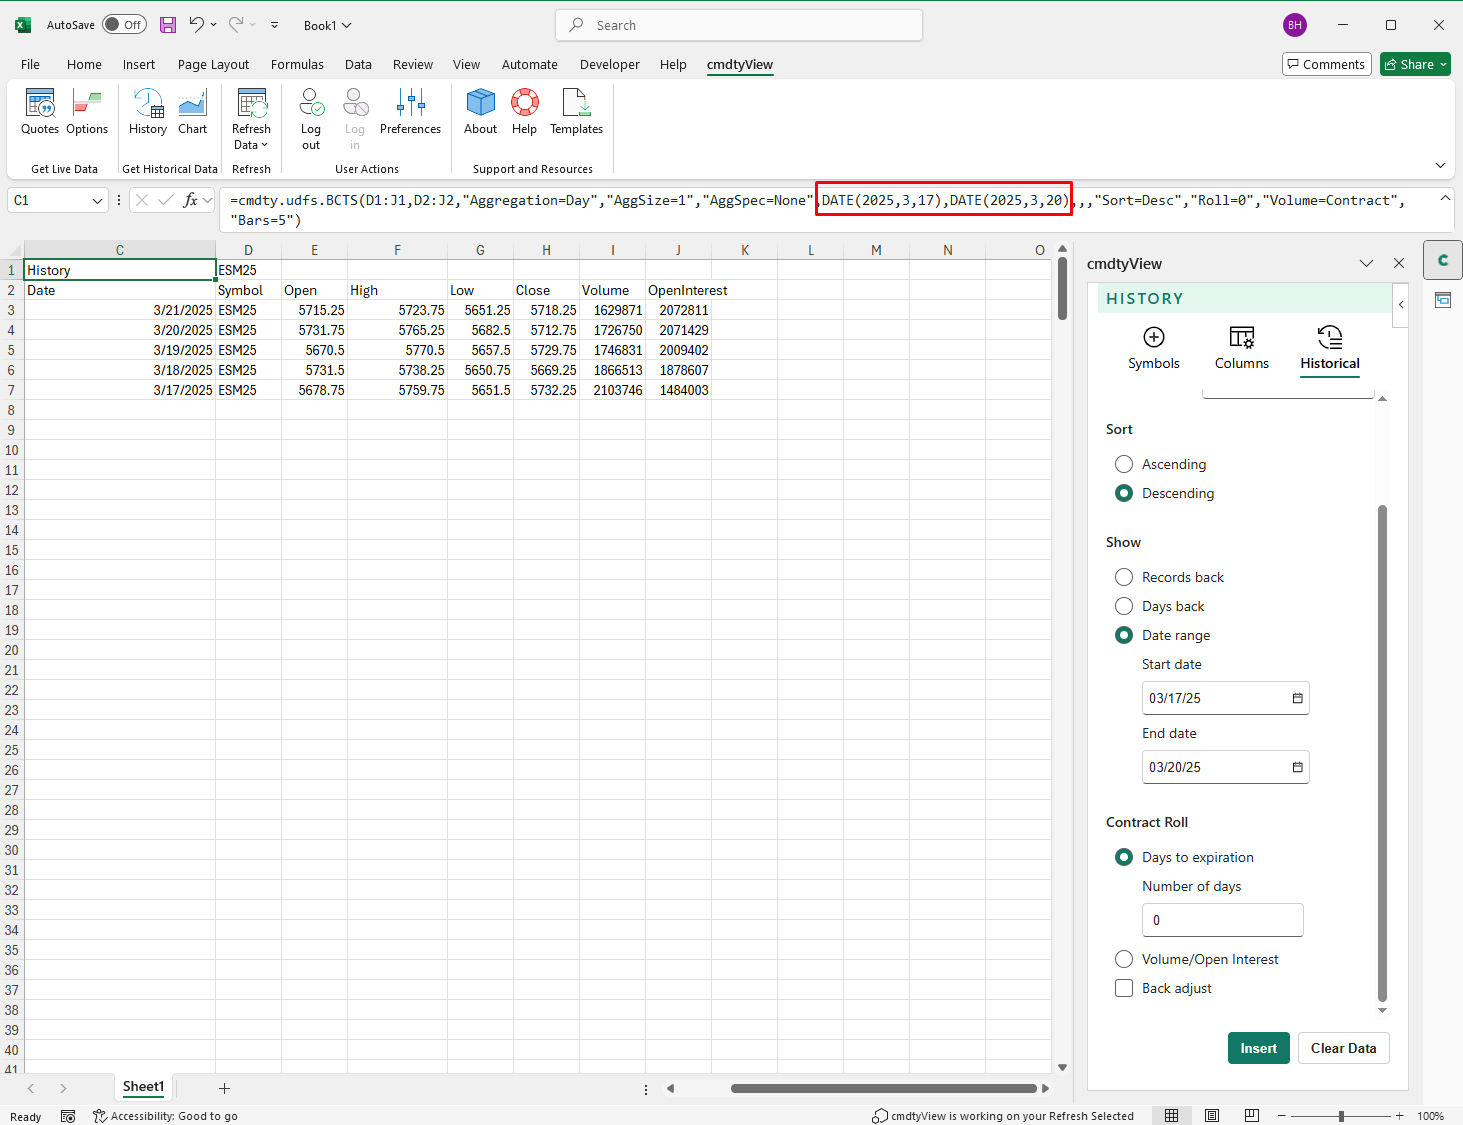
- Date Range: If both a start and an end date are specified, then all records within the specified range will be returned.
Contract Roll
For futures, multi-contract nearest queries (data parameter set to dailynearest, weeklynearest, monthlynearest, quarterlynearest or yearlynearest), this parameter can be set to one of two values (days to expiratoin, volume/open Interest), and determines how the switch from one contract to the next in the series is calculated. When the value specified is ‘days expiration’, the switch from one contract to the next in the series will be based on the expiration date (and the value of the ‘daystoexpiration’ parameter if specified). When the value specified is ‘volume/open interest’, a combination of volume and openinterest will be used to determine when to switch from one contract to the next in the series.
Back Adjust
Historical data can be adjusted for both futures and stocks using the Adjustments drop down. When ‘Back adjust’ is selected for continuations and nearest futures queries, the futures price history is adjusted when switching contract months. This parameter specifies whether the contracts in the series will be adjusted based on the roll-gap between the closing prices of the current contract and the previous contract on the day of the switch.
Edit a History Table
Edit an existing History table by clicking on the History anchor cell in the spreadsheet. Once the anchor cell is active the History dialgoue will populate with the current inserted symbols and data columns. Make any desired changes including the addition, removal or reordering of symbols and columns. Once the changes have been made, select the Insert button to insert the newly formatted data table into the spreadsheet.
Edit Time Series Syntax
The time series formula syntax is editable, meaning you can change many of the parameters in-line and dynamically change the corresponding results without interacting with the UI/History button in the ribbon. Click the History anchor cell for any table and modify the formula and see what changes.
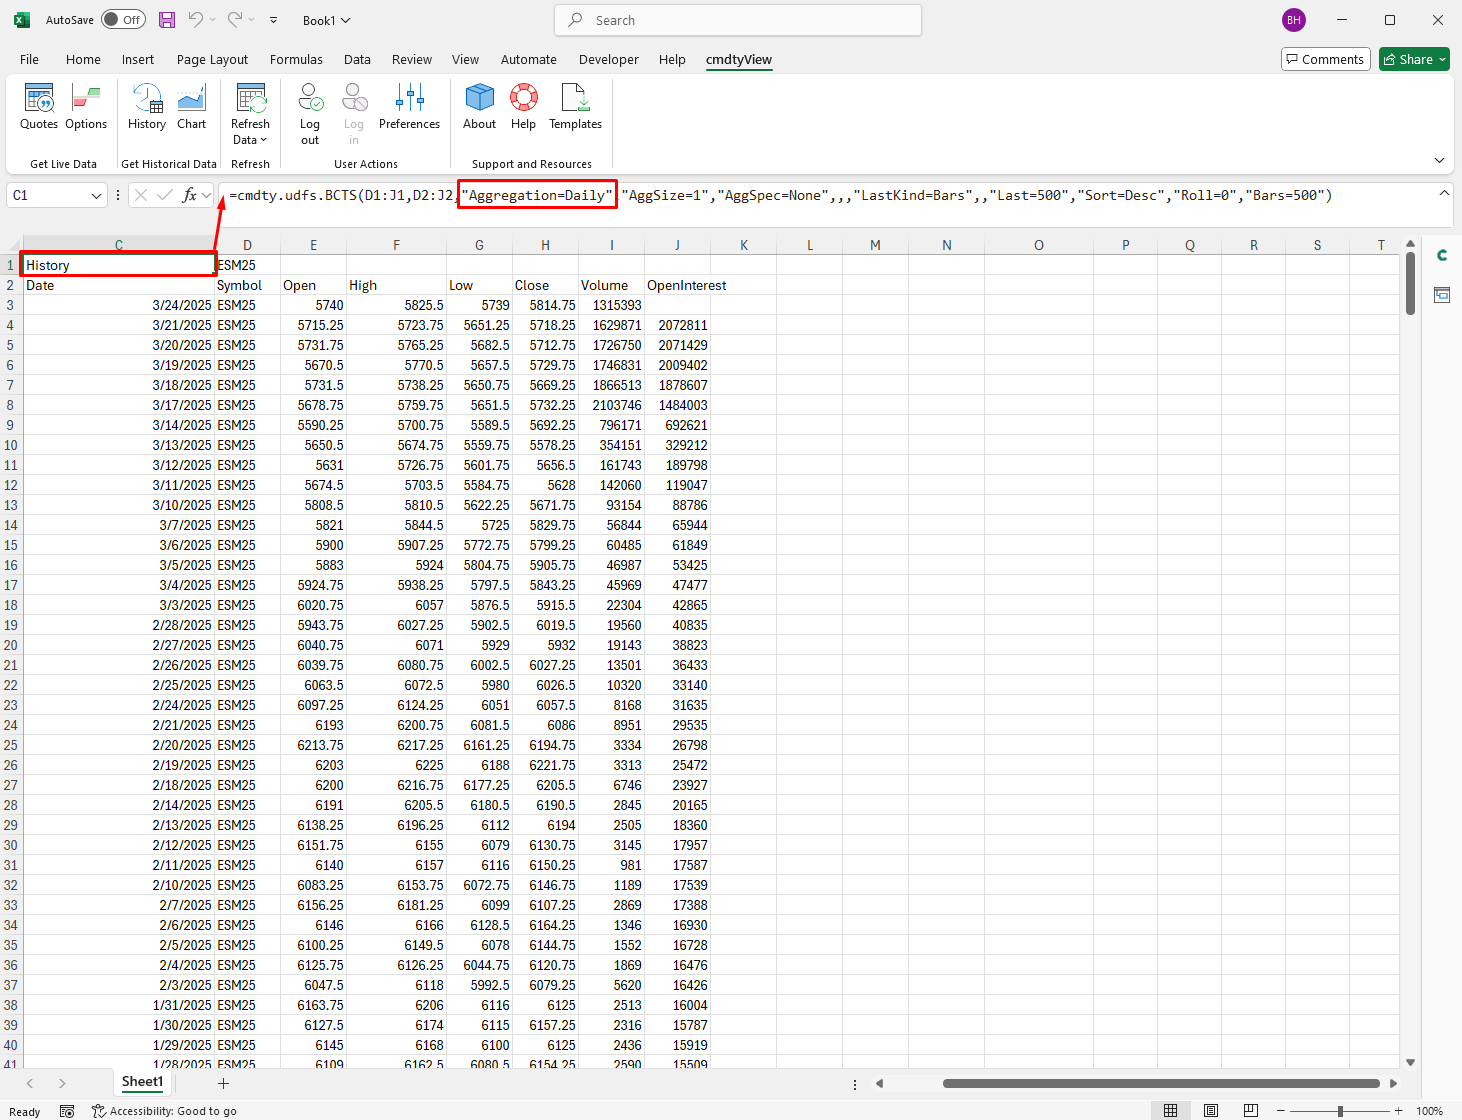
Below the Aggregation is set to Daily:
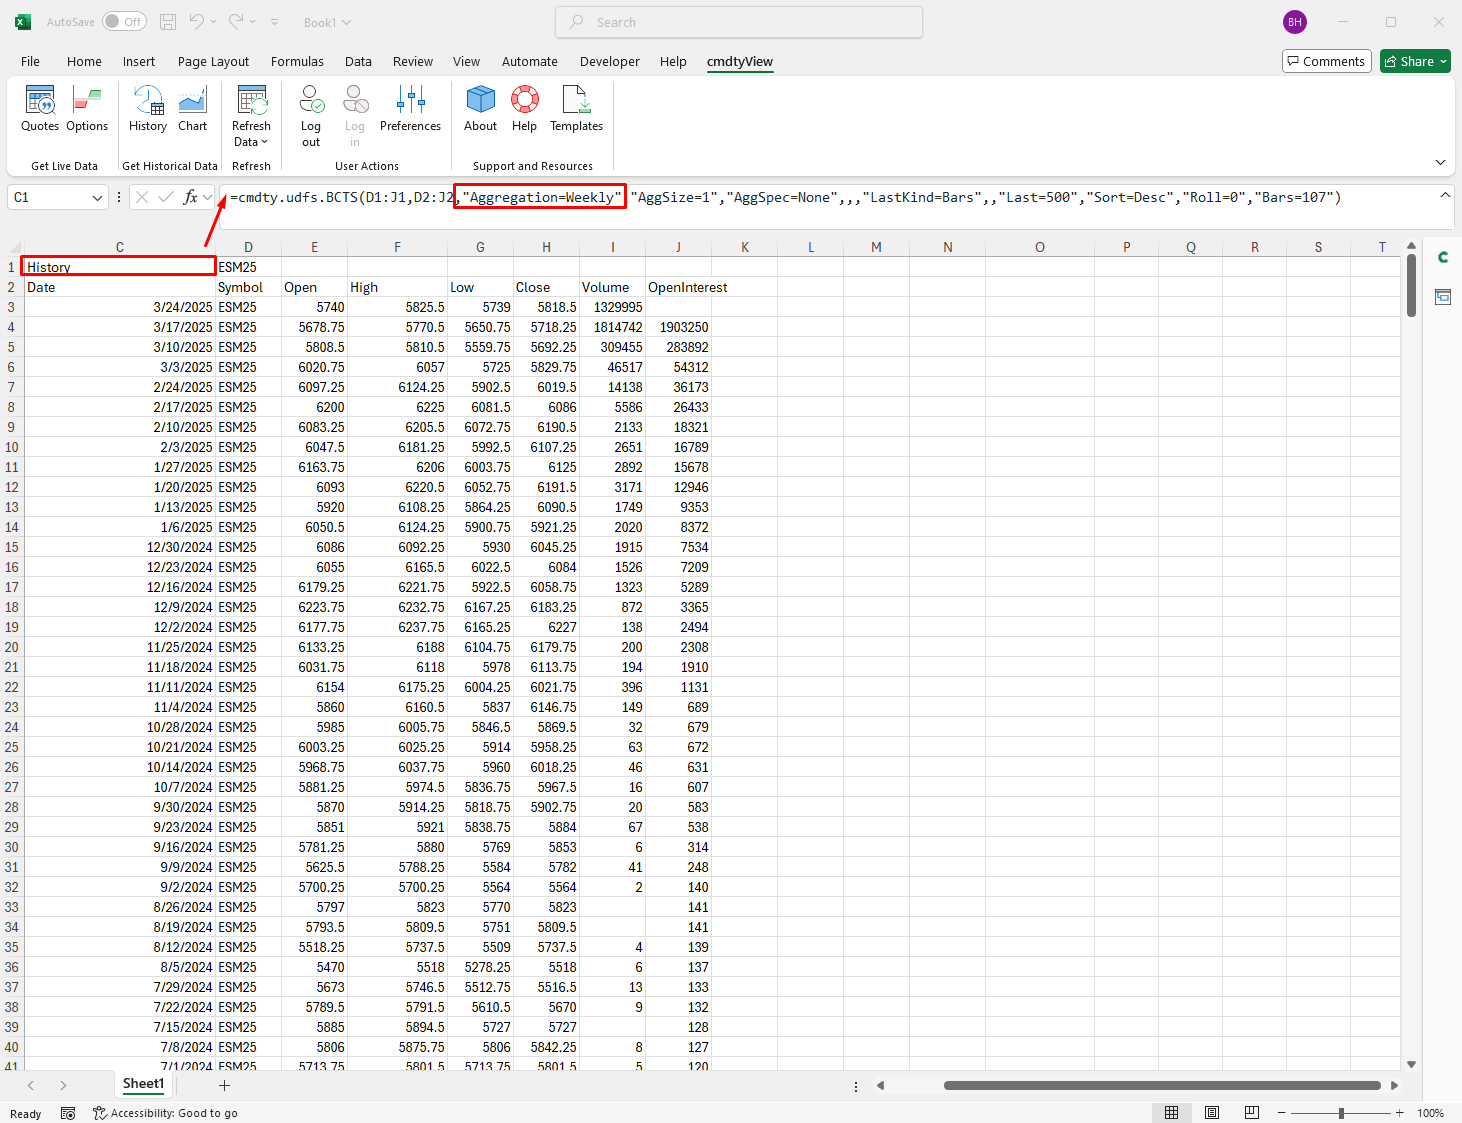
Same query with Daily changed to Weekly:
When start and end dates are applied, the dates can be updated by manually updating the dates in the query.
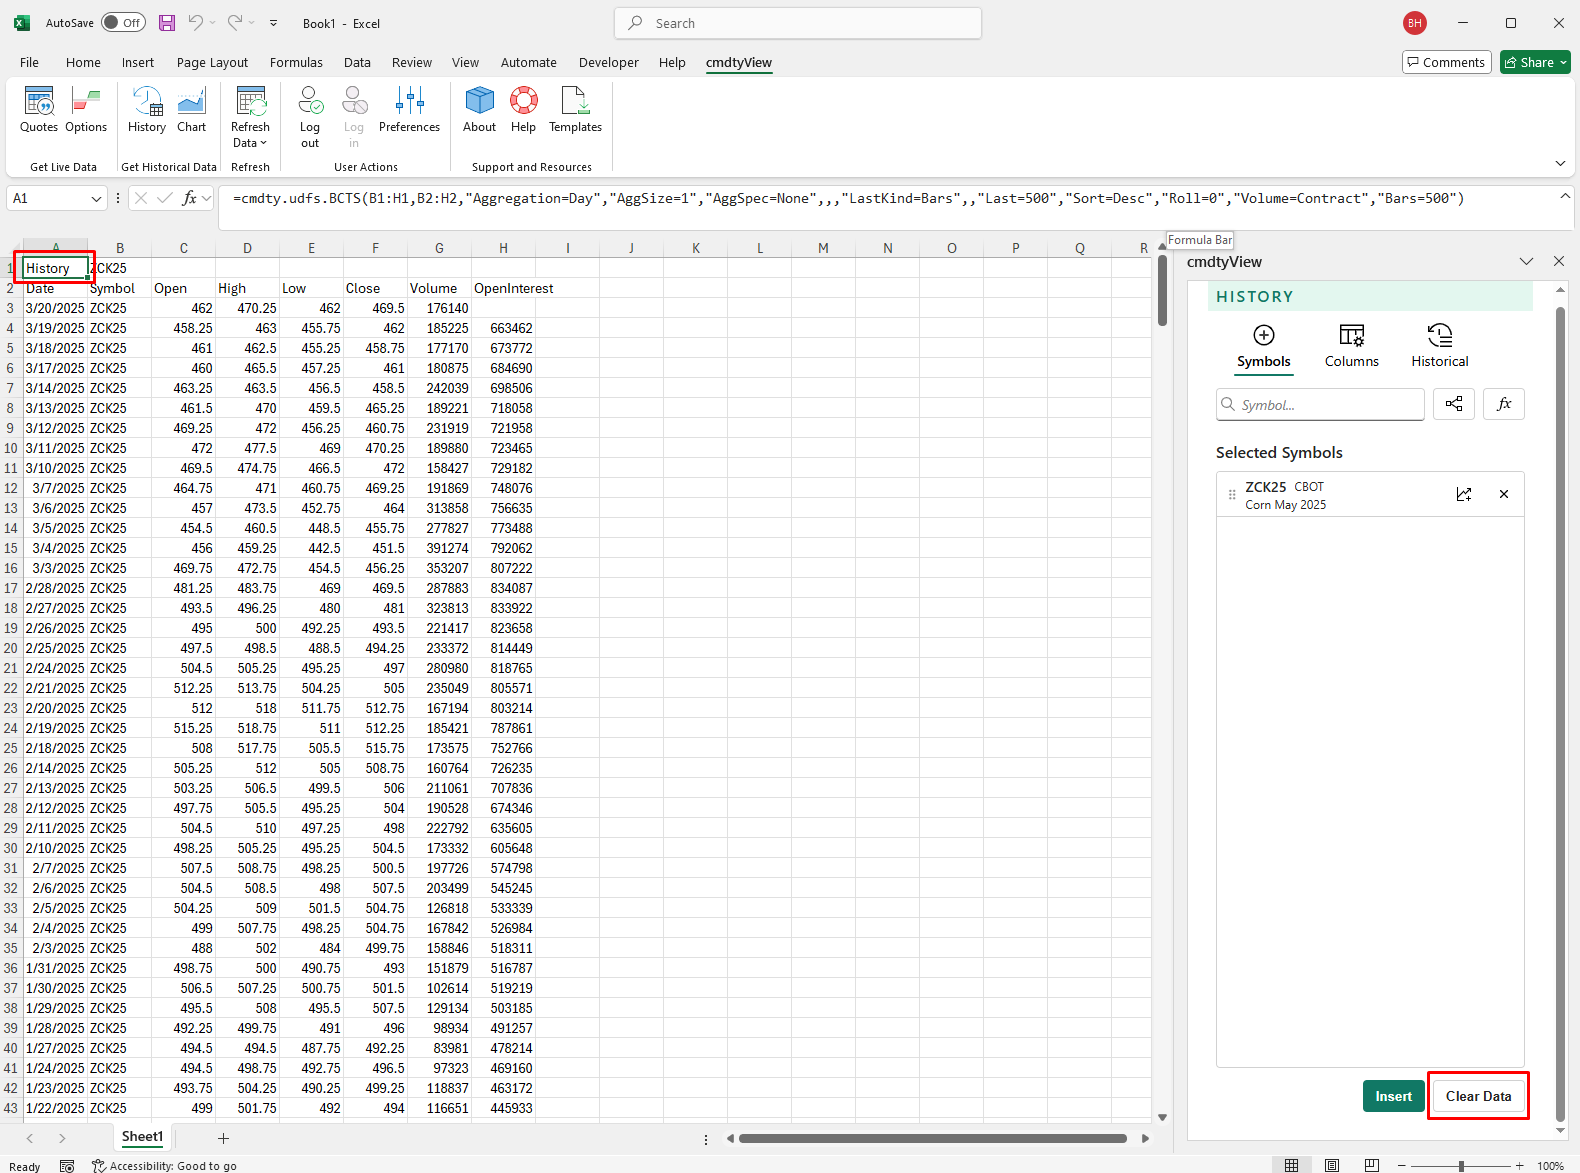
Clear History
Any History table that is inserted into a worksheet can be quickly removed by clicking on the History anchor cell and then selecting the Clear Data button.
Query Usage and Limits
Below are the historical query and usage limits for cmdtyView for Excel.
End of Day (EOD)
| DEFAULT_EOD | Daily | Hourly | |
|---|---|---|---|
| 50,000 | 5,000 | ||
| DEFAULT_MIN | Daily | Hourly | |
| 20,000 | 2,000 | ||
| DEFAULT_TICK | TICK_Days | TICK_Daily | TICK_Hourly |
| 30 | 5,000 | 500 |