Studies
Add Historical Study Data
Historical study data on over 100 technical indicators is accessible via the History and Chart icons. For Historical data, after a symbol is selected and placed into the insert symbol pane you will see an Apply Study button.
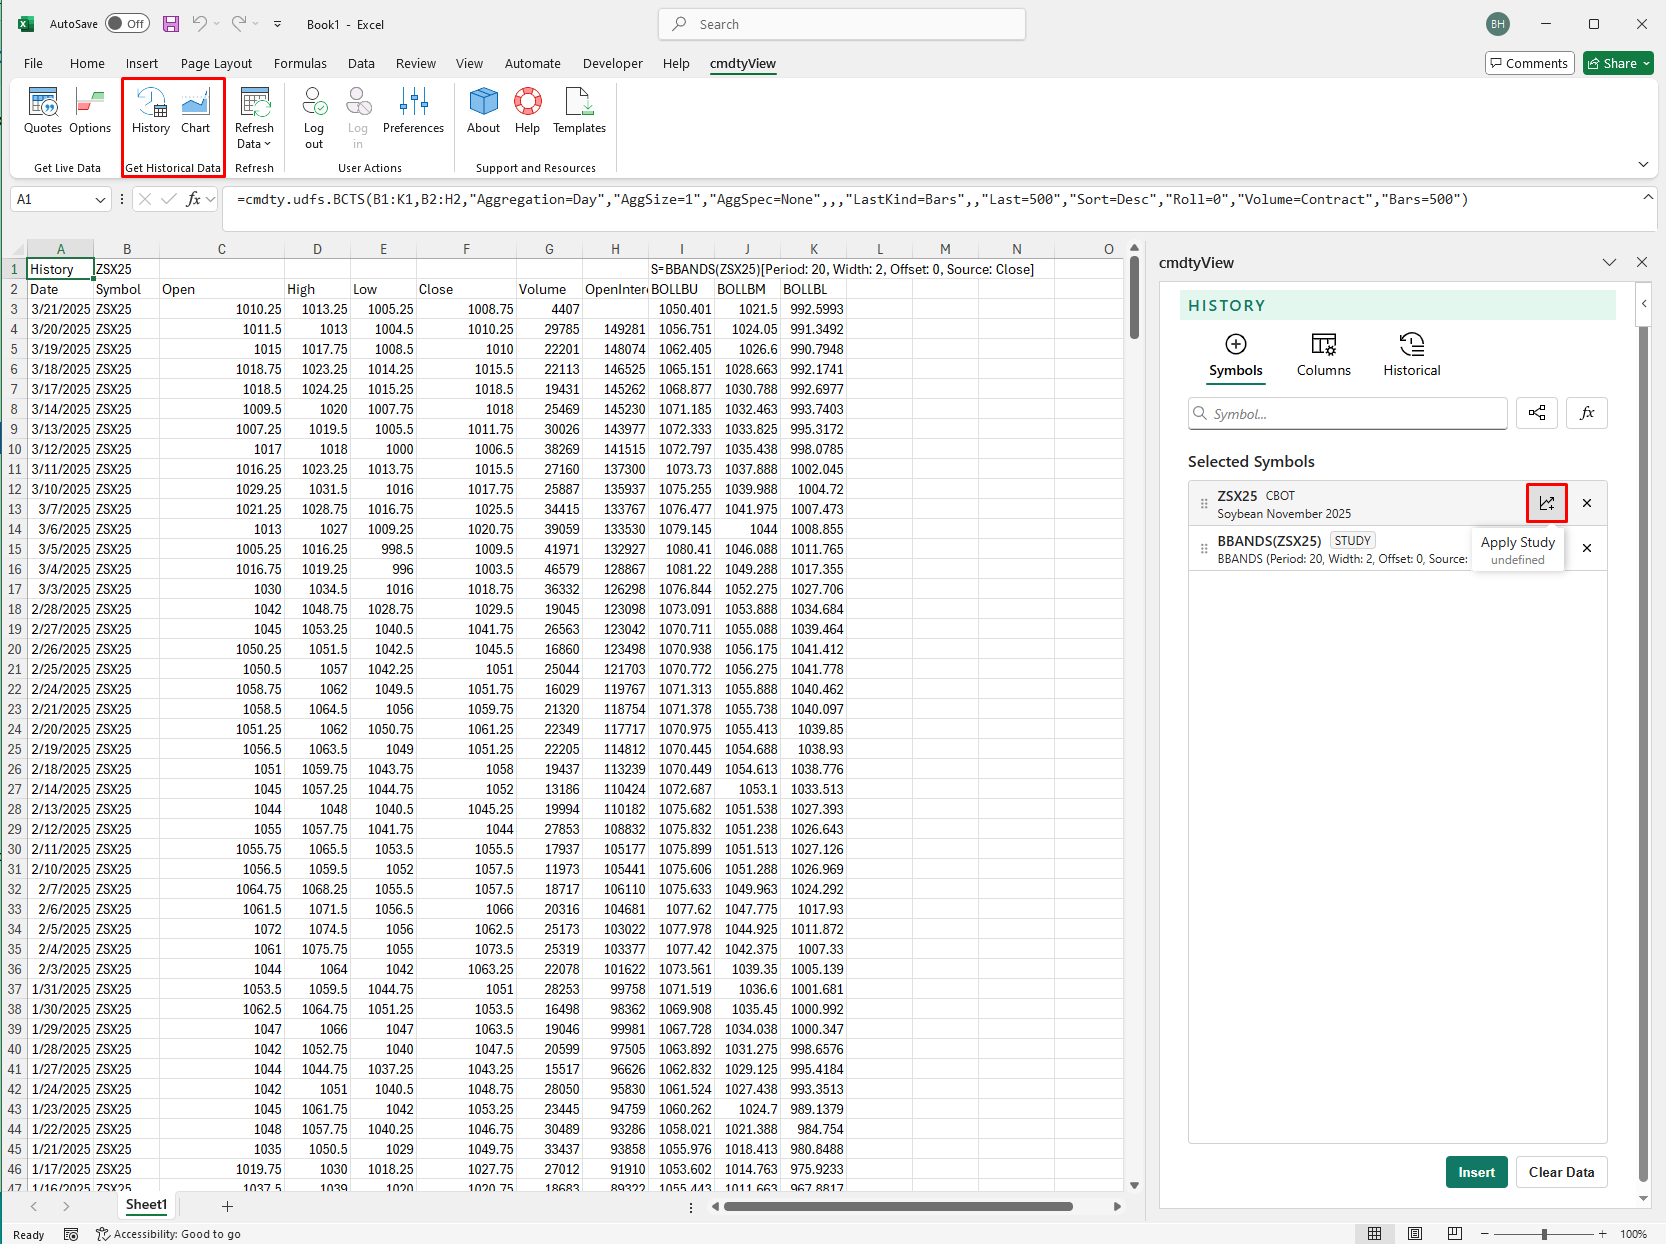
Click on the Apply Study button and a menu will display with all the available indicators.
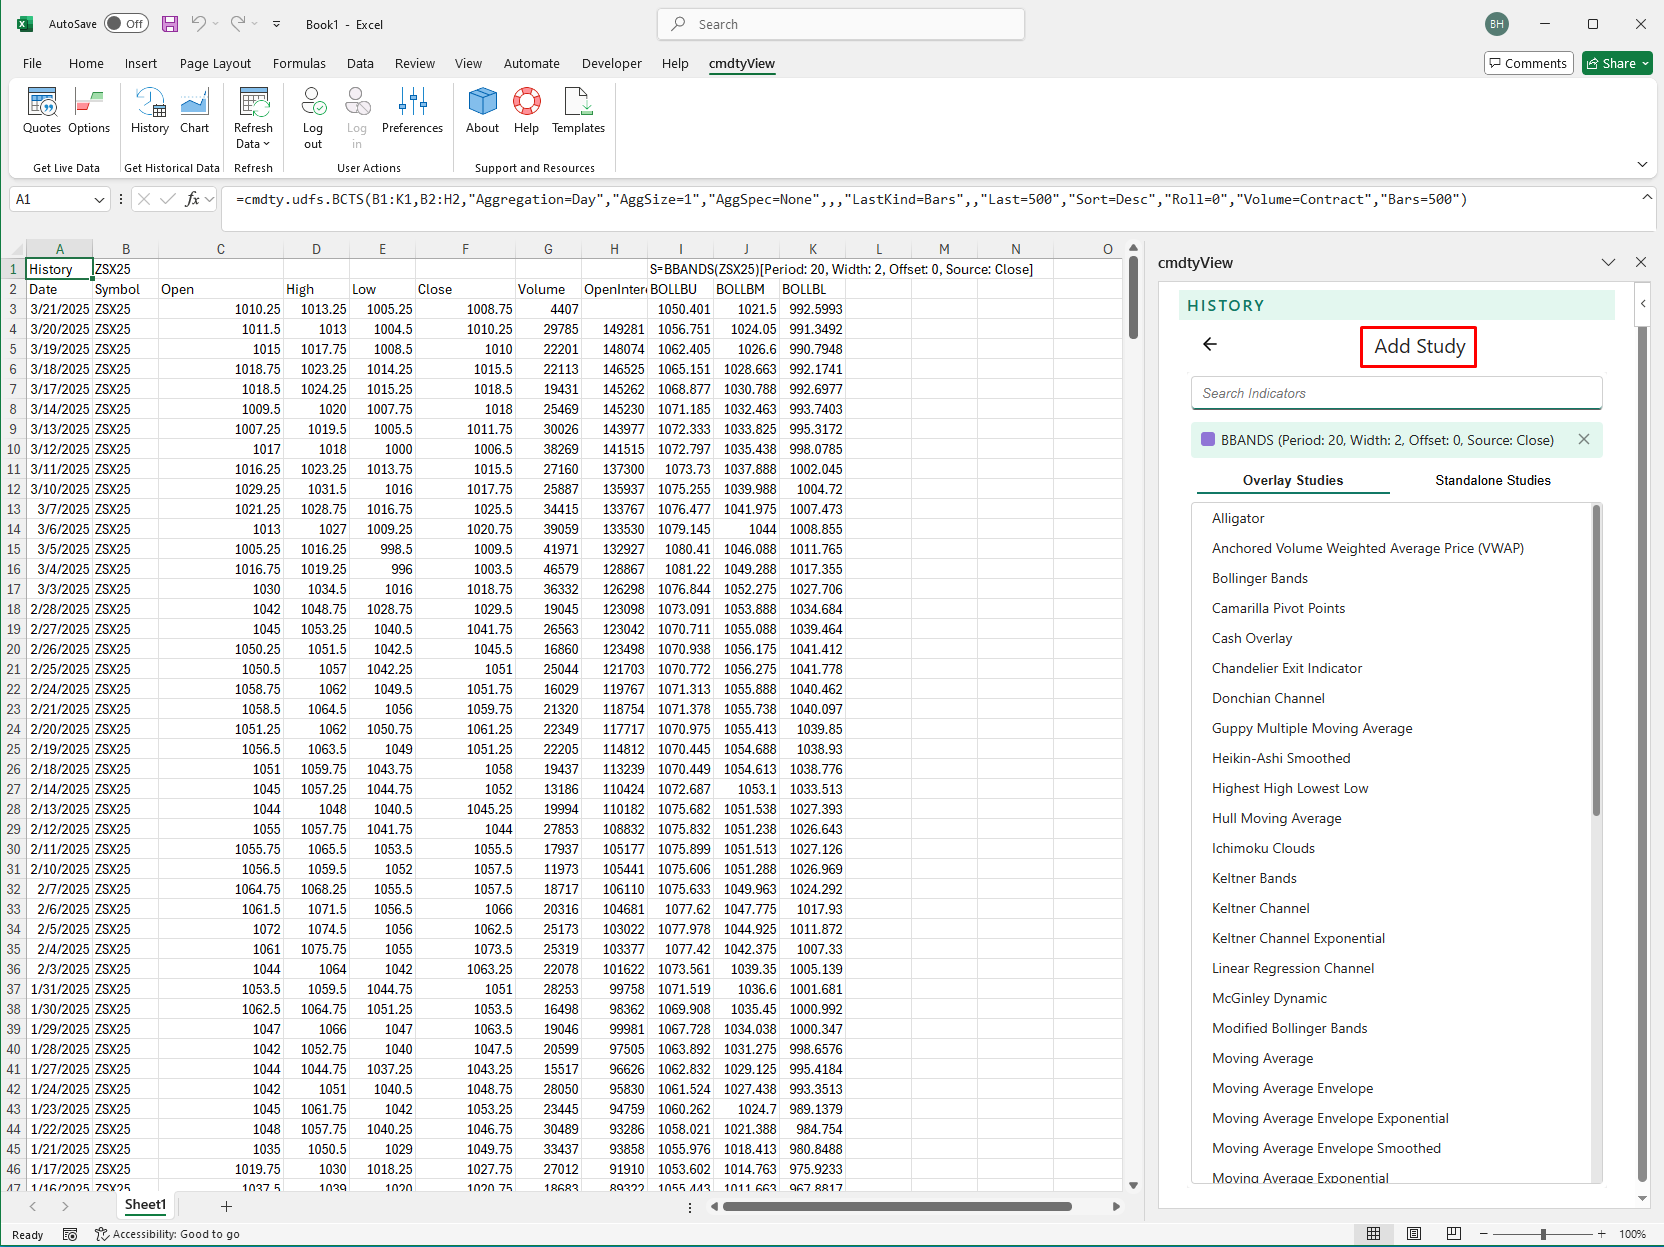
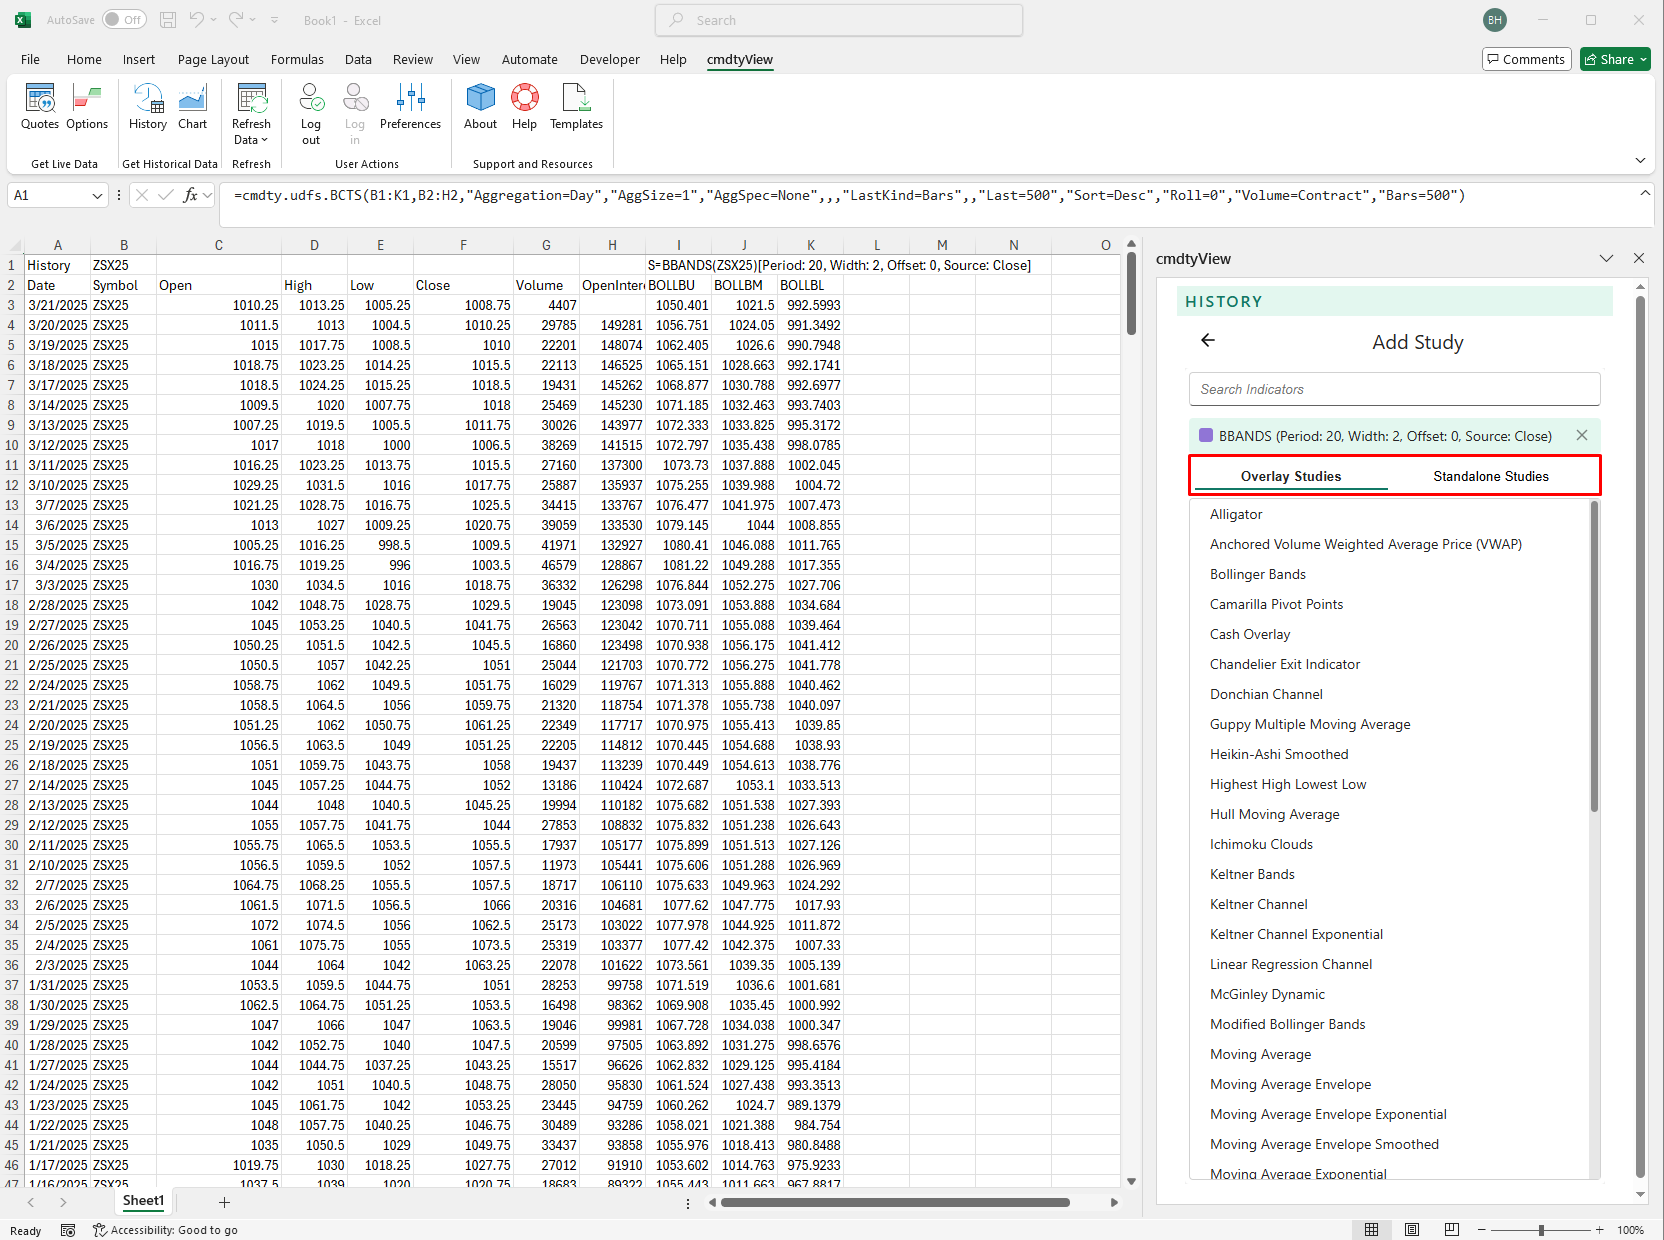
cmdtyView for Excel studies are classified as either Overlay studies (plotted in the same pane as the symbol data) or Stand-alone studies (a study that uses a different price scale than that of the underlying symbol).
After selecting the indicators you wish to apply, click the arrow and return to the symbol insert dialogue.
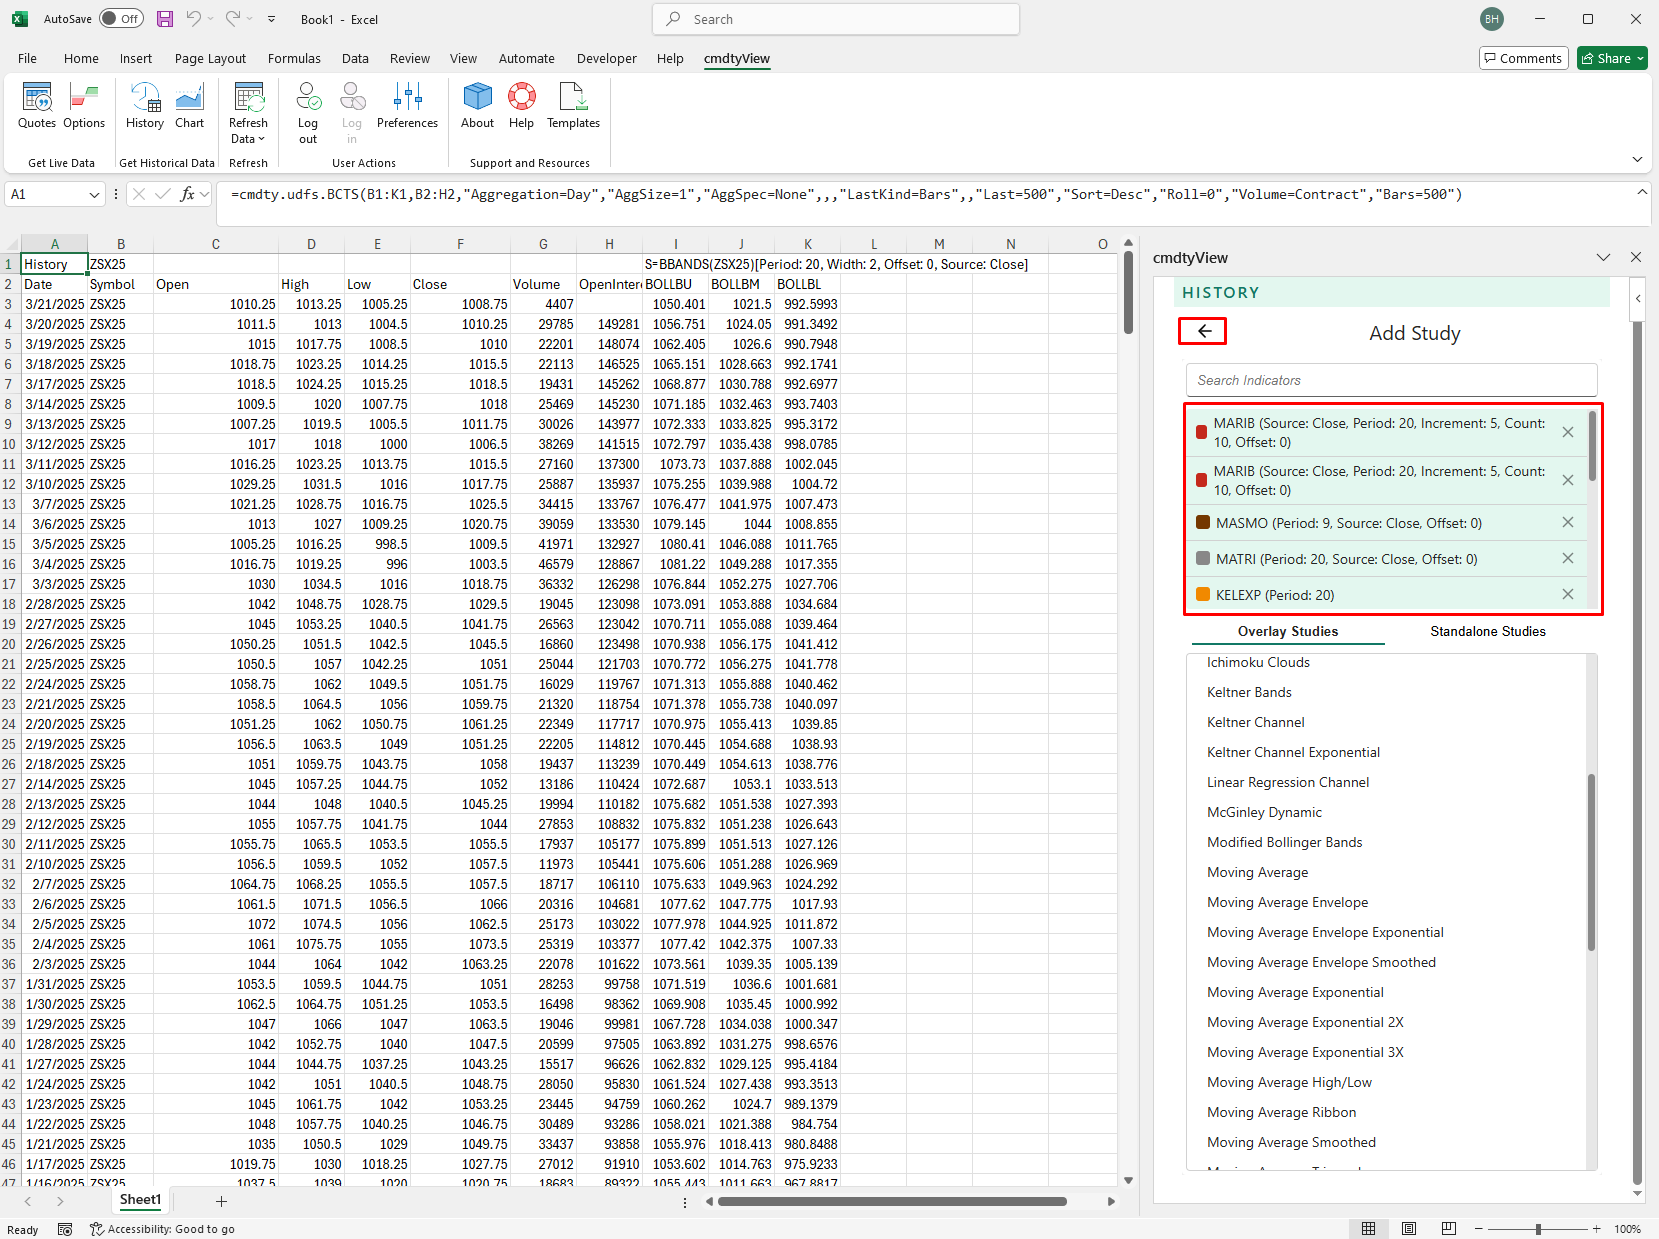
Here you can customize the input variables by selecting the Edit Study button.
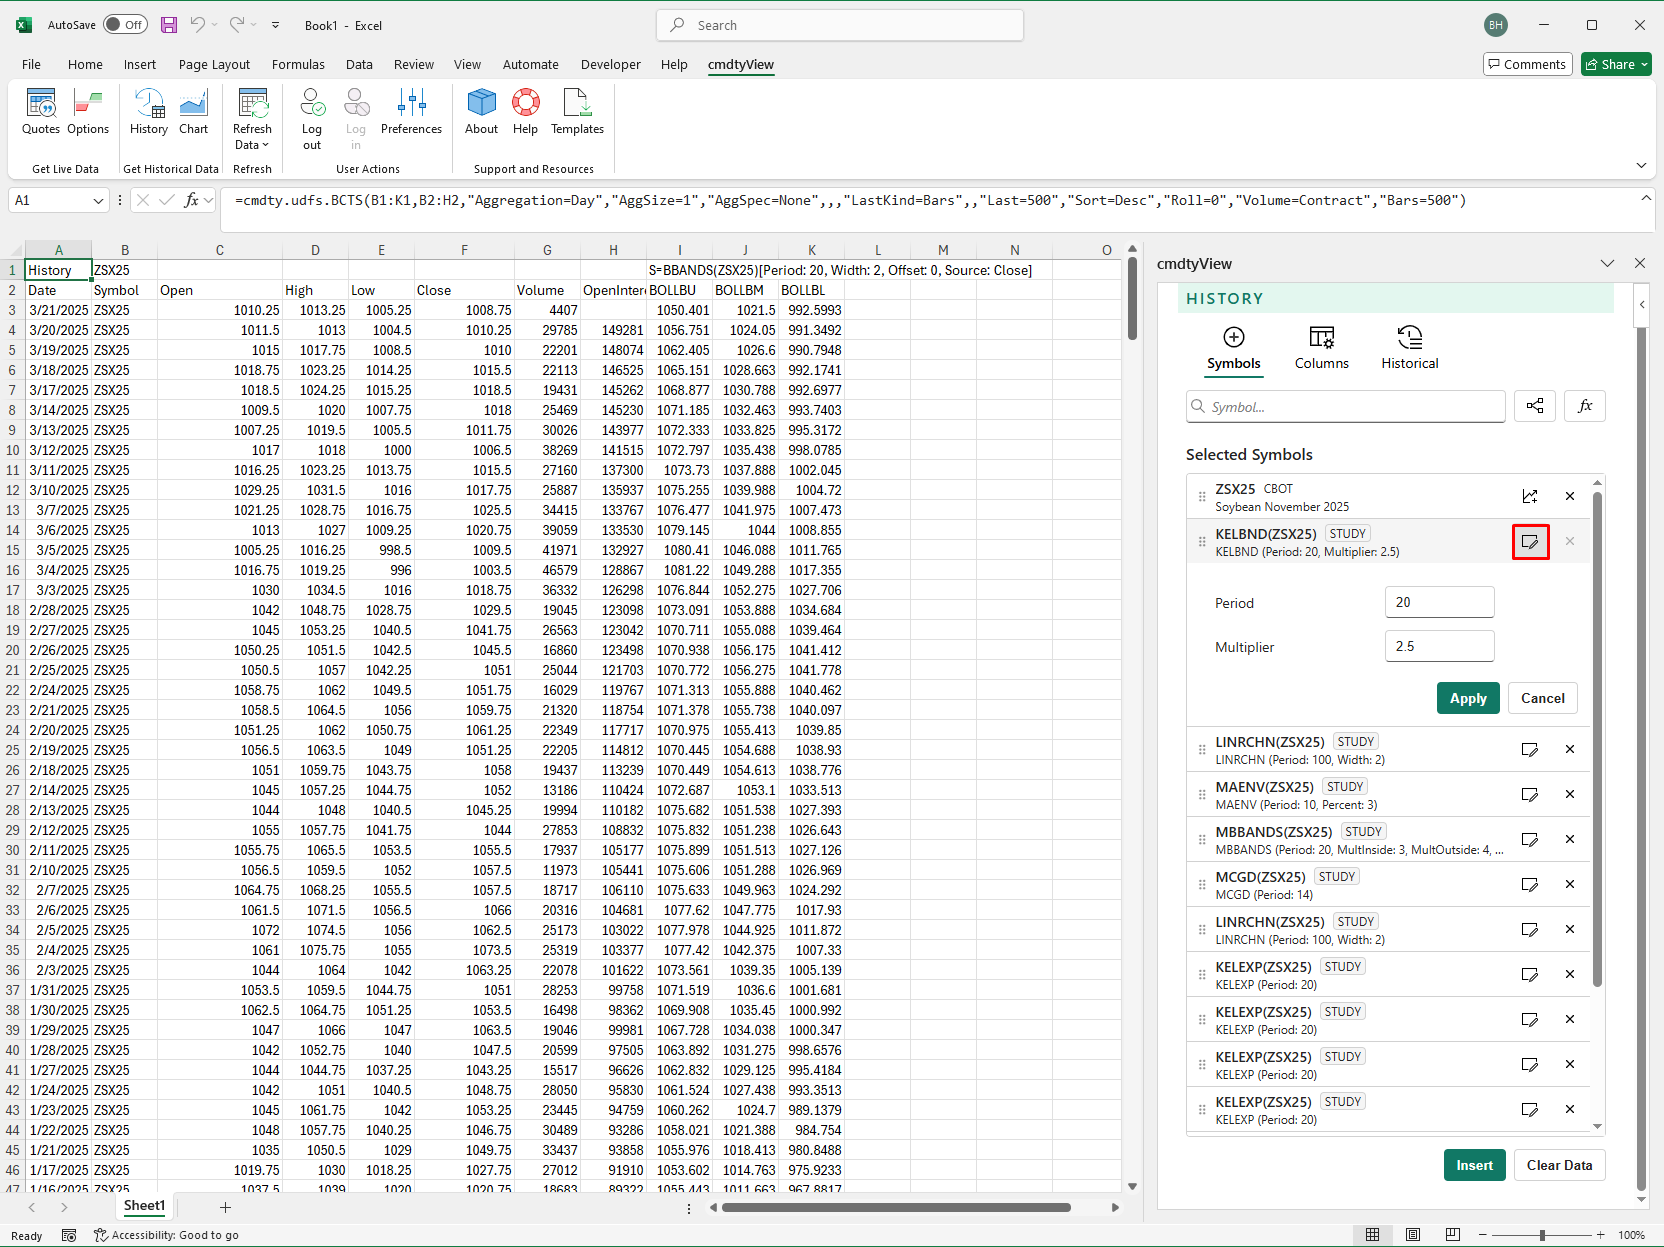
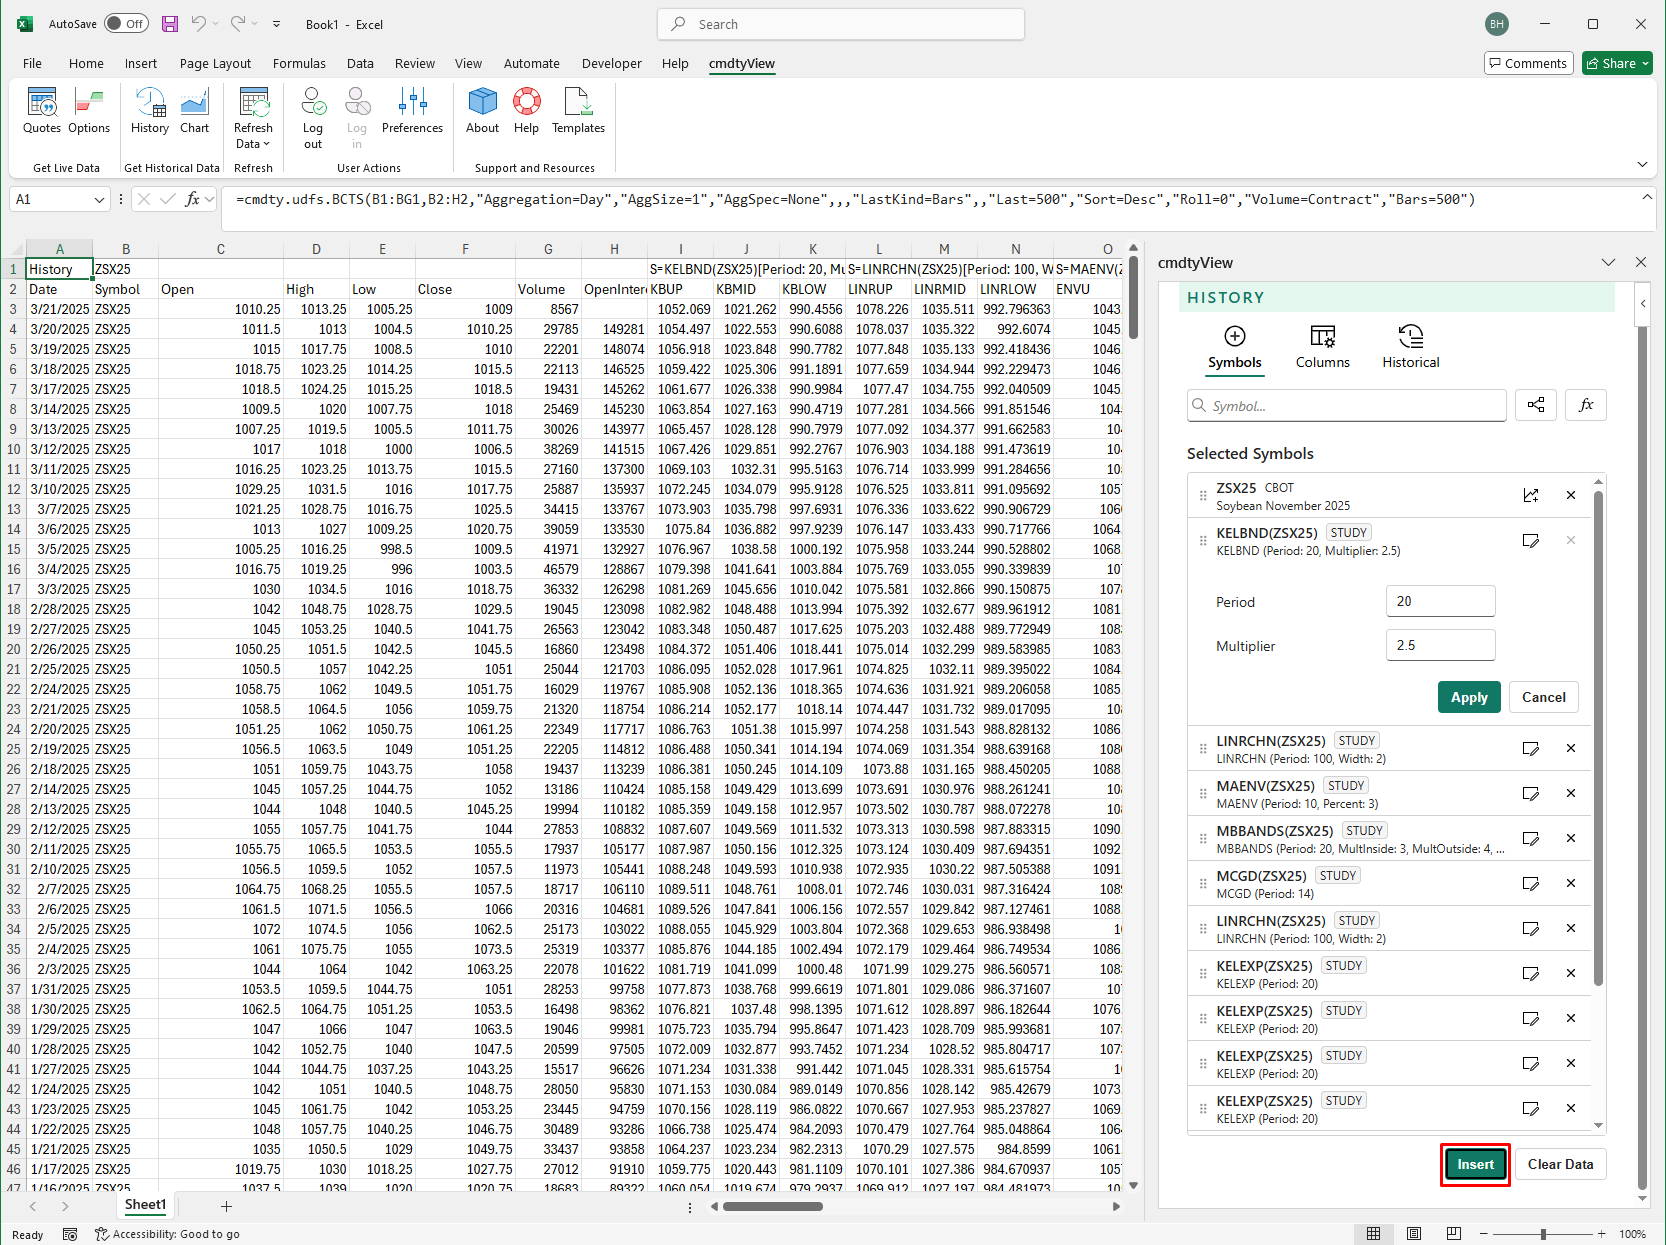
Select your Columns and historical data options and then click Insert and the corresponding data will display in the spreadsheet.
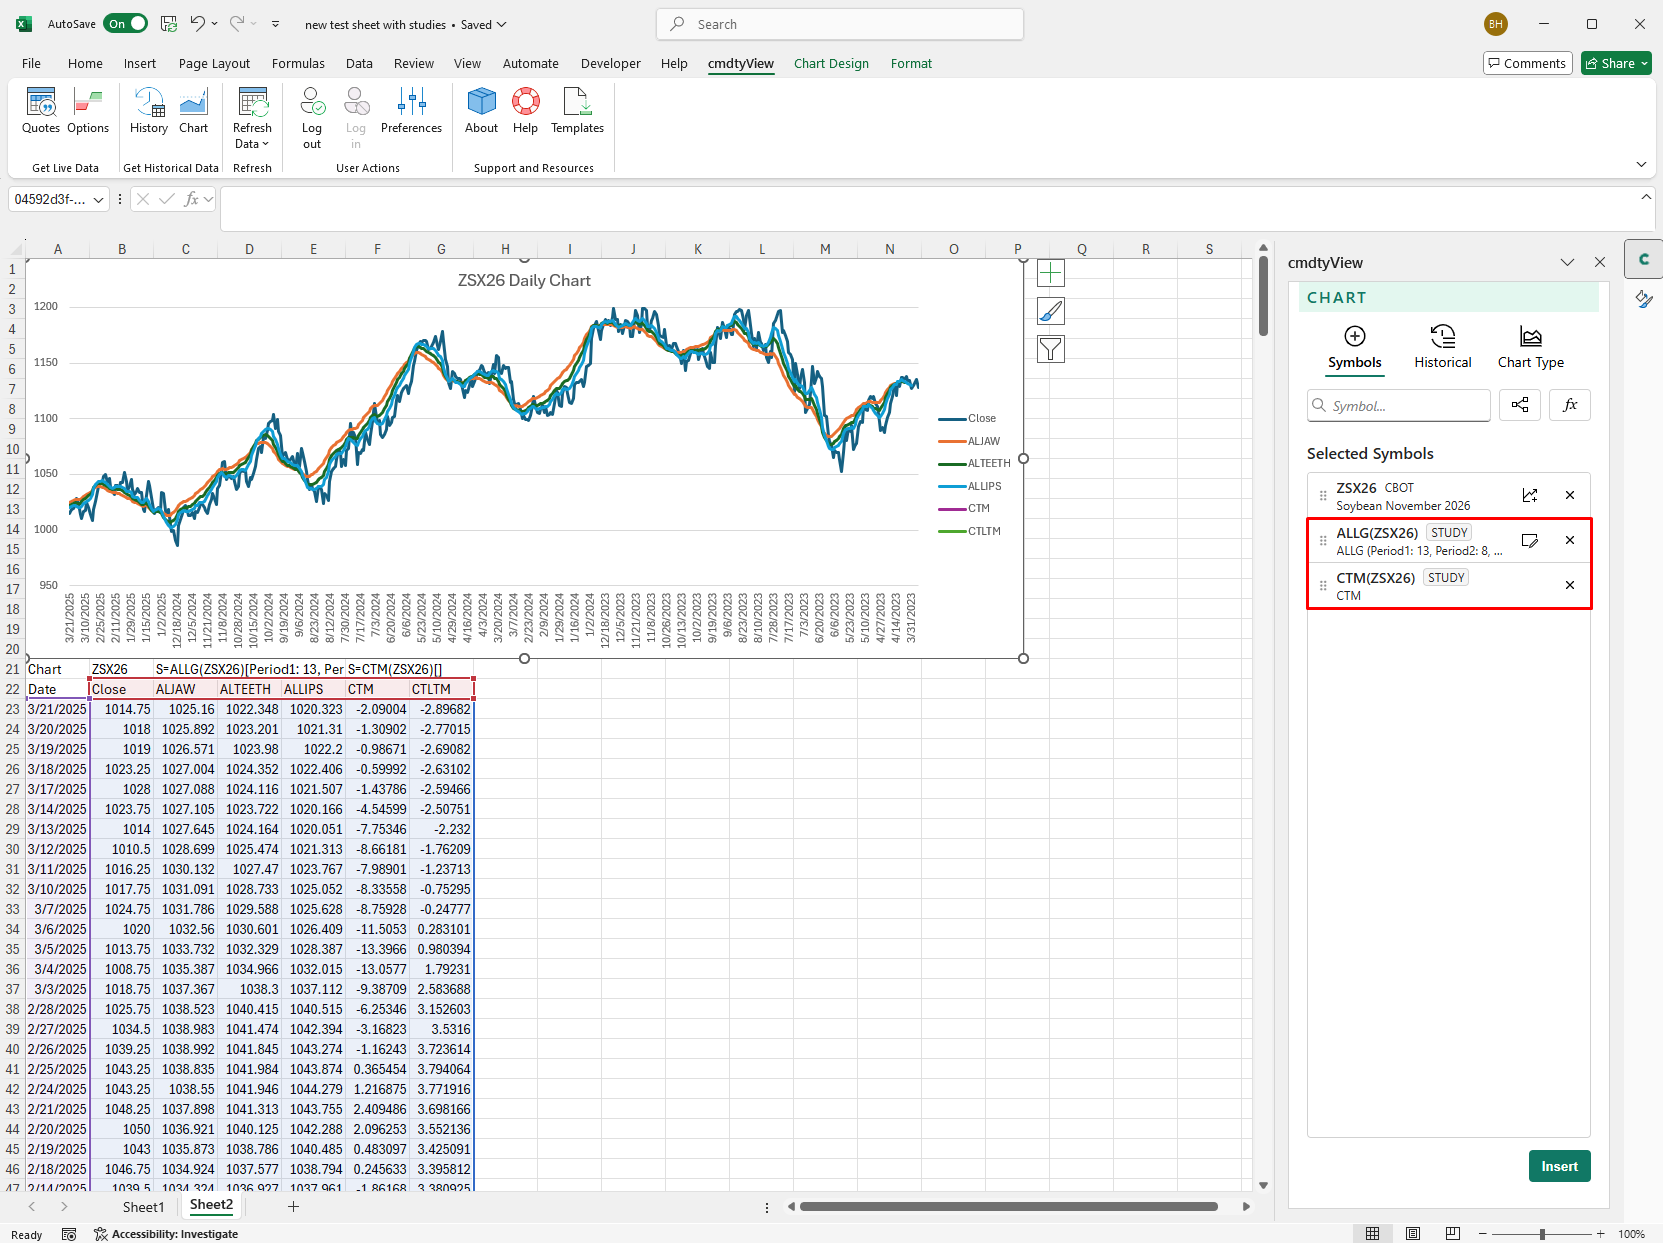
Add Chart Study Data
For Charts, the same steps will provide historical indicator data directly to the chart. Once a symbol is selected, click the Apply Study button and make the required indicator selection and update the parameters. Once finished applying studies, you update your Historical preferences and then click insert to view the chart.
Available Studies
A complete list of studies and detailed descriptions and calculatons can be found here
| Moving Average | Moving Average Envelope | Moving Average Envelope Exponential | Moving Average Envelope Smoothed | Moving Average Exponential |
| Rate Of Change | Triple Exponential | Moving Average Exponential 2X | Moving Average Exponential 3X | Moving Average High/Low |
| Moving Average Smoothed | Moving Average Triangular | Moving Average Weighted | Volume Moving Average | MACD Oscillator |
| MACD Oscillator Exponential | Percentage Price Oscillator | Percentage Volume Oscillator | Average Directional Index | Modified Average Directional Index |
| Moving Standard Deviation (required for Bollinger studies) | Bollinger Bands | Bollinger Width | Bollinger Bands %B | Typical Price (required for CCI) |
| Commodity Channel Index | Parabolic Time/Price | Percent Change | Stochastic, Fast | Stochastic, Slow |
| Average True Range | Adjusted Average True Range | Change Over Average True Range | Relative Strength Index | Relative Strength Index Modified |
| Stochastic RSI | Percent R | Historical Volatility | Alligator | Aroon Up/Down |
| Aroon Oscillator | Awesome Oscillator | Close Location Value | Chaikin Money Flow | Chaikin Accumulation Distribution |
| Accumulation/Distribution Williams | Chaikin Oscillator | Chaikin Volatility | Chande Momentum Oscillator | Coppock Curve |
| Detrended Price Oscillator | Donchian Channel | Donchian Width | Ease Of Movement | Elder Ray Bull |
| Elder Ray Bear | Force Index | Highest High Lowest Low | Hull Moving Average | Ichimoku Clouds |
| Keltner Channel | Keltner Channel Exponential | Keltner Bands | Mass Index | McGinley Dynamic |
| Momentum | Money Flow Index | Moving Linear Regression | On Balance Volume | Oscillator |
| Volume Oscillator | Price Performance | Pivot Points Bands | Plot Line | Price Volume Trend |
| Stochastic Momentum Index | Supertrend | True Strength Index | Turtle Channel | Turtle Channel Retracement |
| Volatility Stop | Negative Volume Index | Positive Volume Index | Volume | Open Interest |
| VWAP | Weighted Close | Welles Wilder Volatility | Linear Regression Channel | Wilder Accumulative Swing Index |
| Retracement ATR High | Retracement ATR Low | Guppy Multiple Moving Average | Anchored VWAP | Schaff Trend Cycle |