Syntax and Functions
cmdtyView for Excel Functions
BCD Function
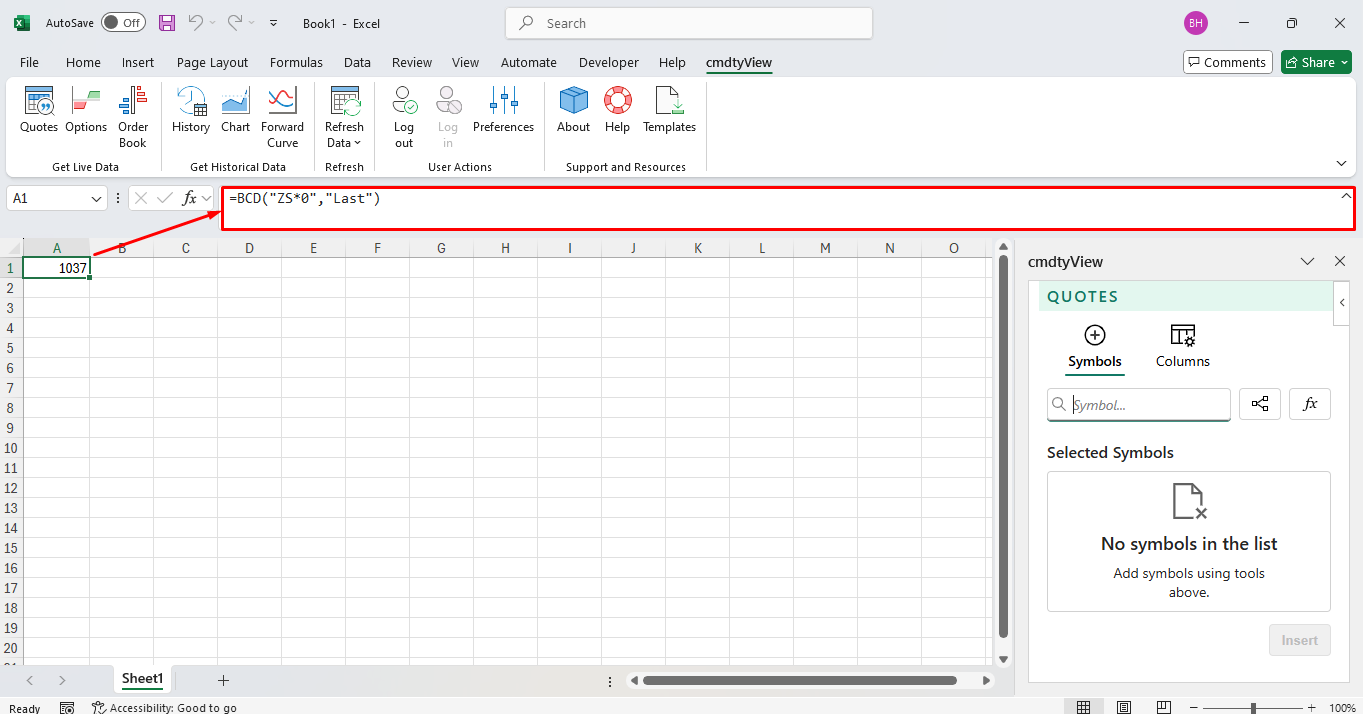
Using the following function, cmdtyView for Excel users can pull in any of the streaming quote ‘Columns’ or fields into a specified cell in a worksheet:
=BCD(“Symbol”,“Field”)
To get the last traded price for most active CBOT Soybeans (“ZS * 0”) - apart from using the UI and selecting the Quotes button and then searching for and selecting the symbol in question and then the desired field - you may type in a cell =BCD(“ZS*0”,“Last”)
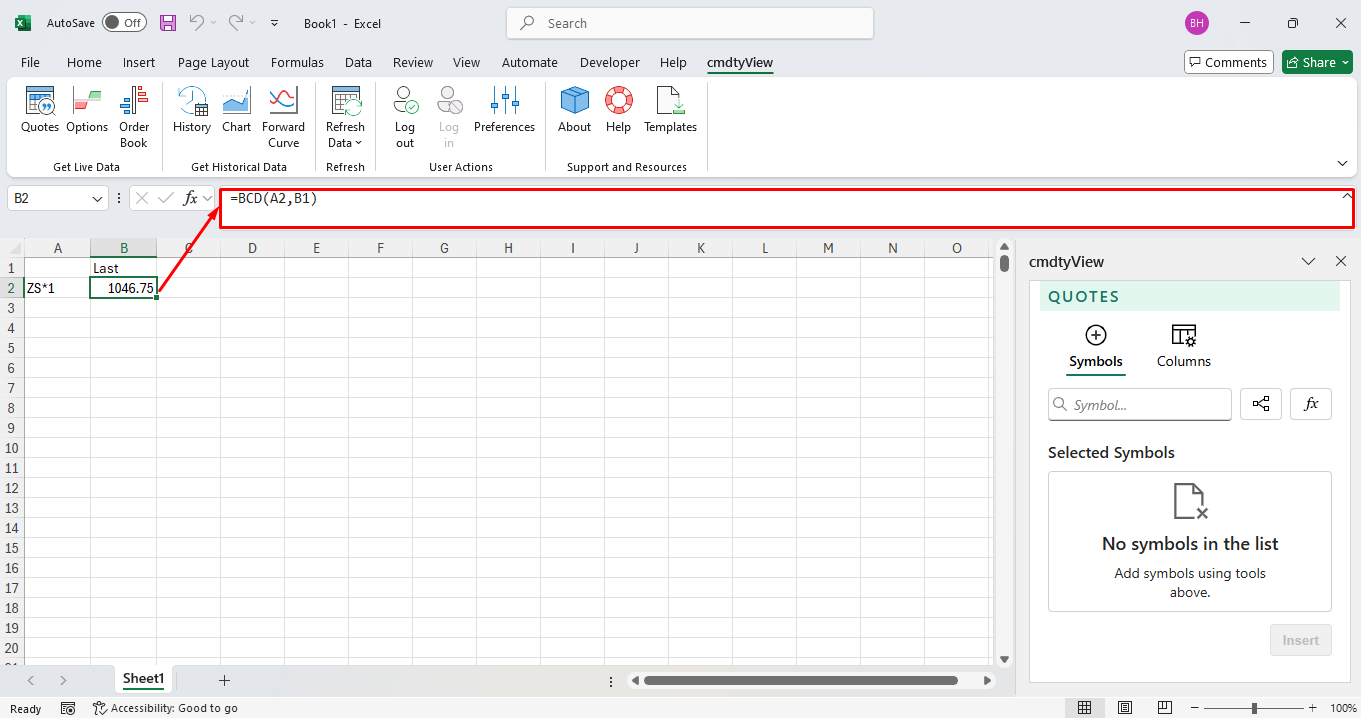
A single symbol and single field can be entered through a cell refence. In the below image, A2 contains the symbol and B1 contains the field. The formual for below is as follows =BCD(A2,B1)
Single symbol and multiple fields can be inserted by locking the rows and columns. The single symbol with multiple field reference in B2 is =BCD($A2,B$1). The $ locks the columns and rows which enables you to drag and copy the formula across multiple columns or rows. Once finished dragging, the cell(s) will automatically update with that field’s value.
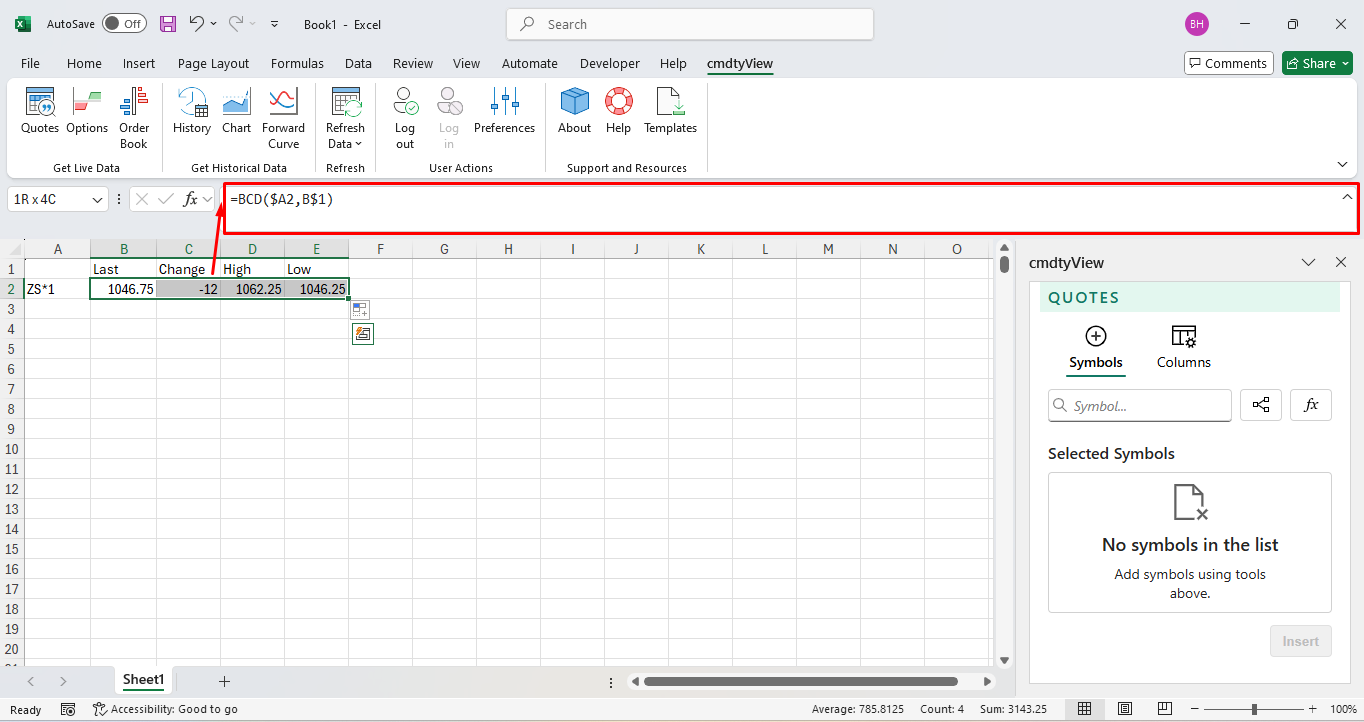
The same logic as above holds true for multiple symbols and and one field. The multiple symbol and single field reference in B2 is =BCD($A2,B$1) again. Now you can click and drag the formula to the other symbols cells. Once finished dragging, the cell(s) will automatically update with that fields value.

(Note: Expressions are supported instruments when using the BCD function as long as the instrument is formatted correctly, “F={ZSN25} - {ZSX25}” as an example).
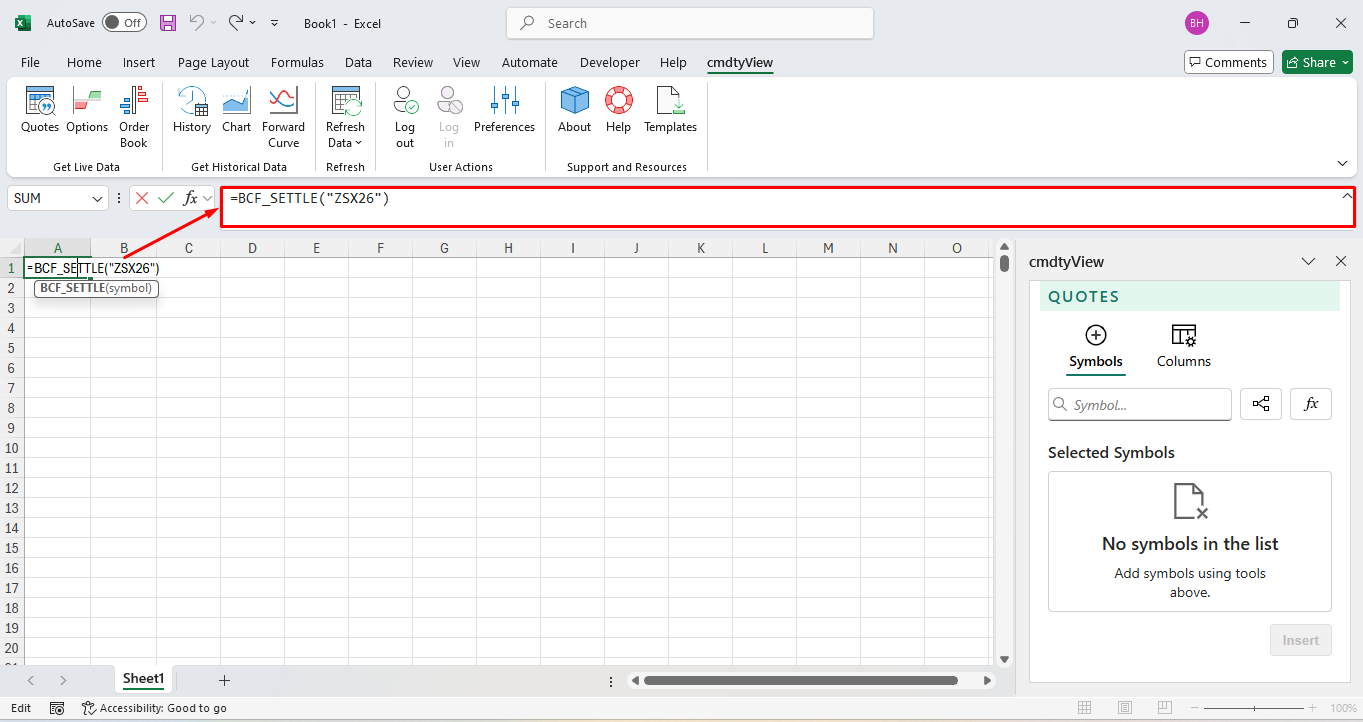
BCF Function
Similar to =BCD, the =BCF function will independently populate a list of fields or arguments that can be inserted into your spreadsheet without needing to know the arguments name. Upon entering in =BCF, you can either scroll through the list or enter in a keyword to narrow the list’s results.
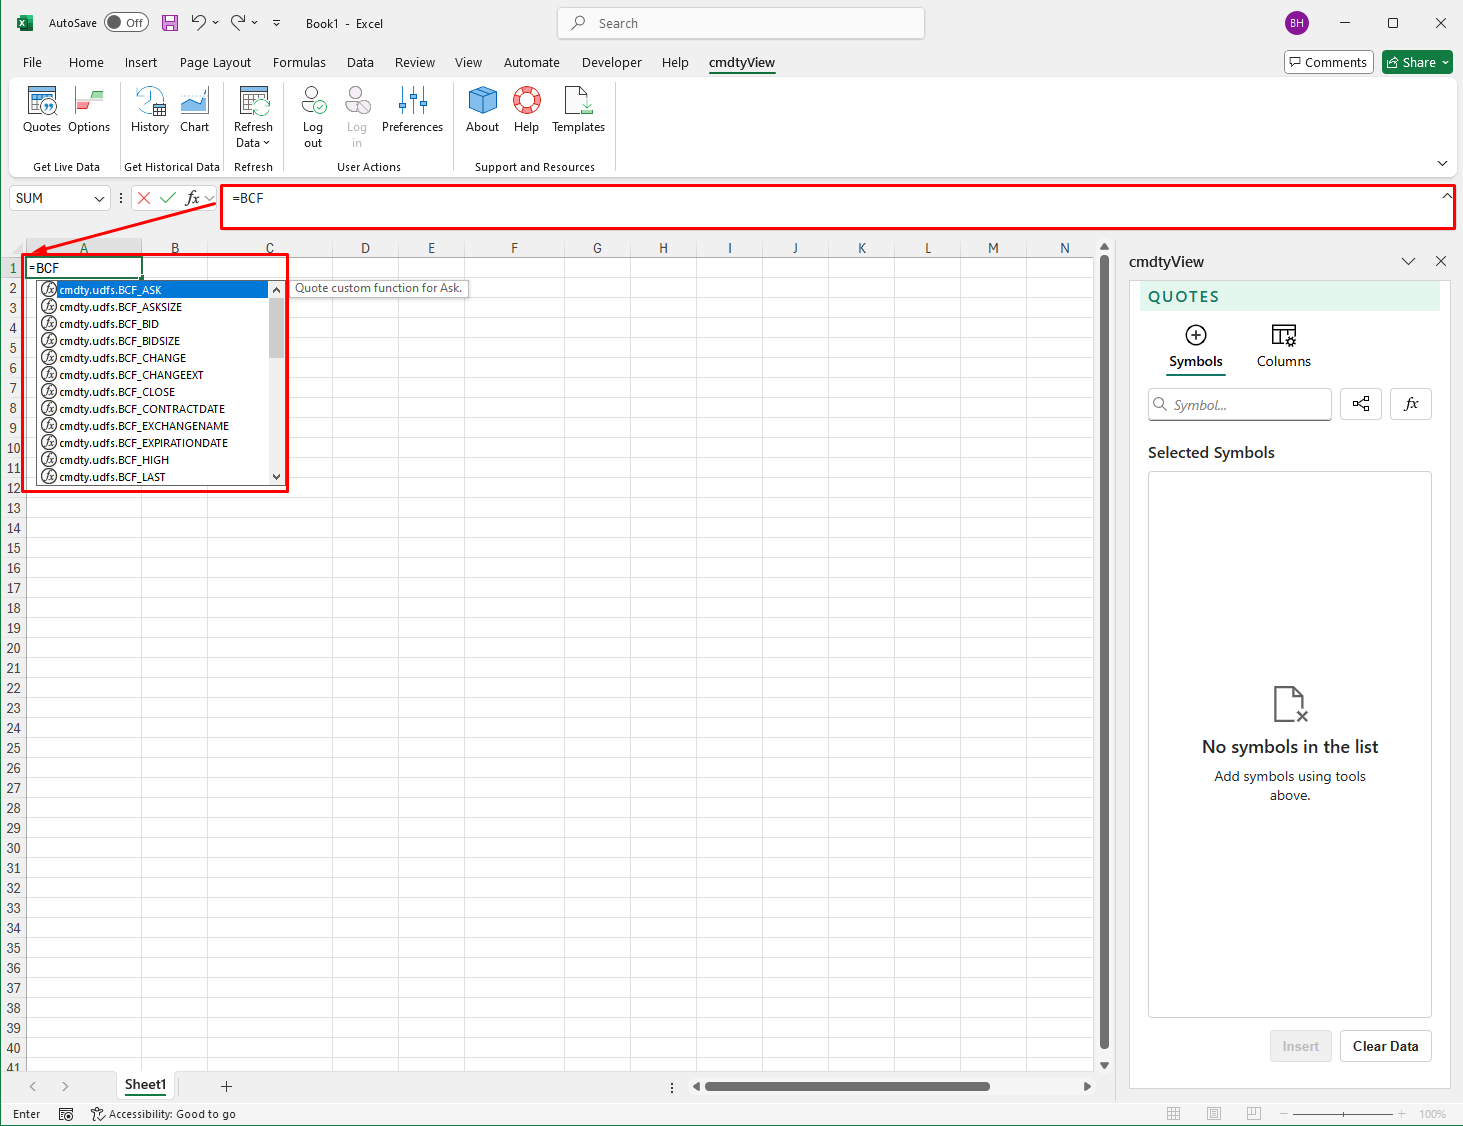
Once a field is selected, the symbol you wish to populate the corresponding data for can be entered as an argument.
BCD and BCF Field and Function Names Documents
Below is a text document that contains all BCD and BCF function field names. These fields can be copied and pasted into excel to pull in data via cell reference.
cmdtyView Fields
AskAskSizeBidBidSizeChangeChangeExtCloseContractDateExchangeNameExpirationDateHighLastLastExtLastSizeLowNameOpenOpenInterestPercChgExtPercent ChangePreviousPrevSettleSettleSizexAskSizexBidSymbolSymbolDescriptionTickDirectionTimestampUnderlyingFutureVolumeVolumeTimestampBelow is a text document that contains all of the BCF functions. Copy and paste any of the functions into Excel (with a ‘equals sign’ prefix) to quickly pull in data into your spreadsheet.
cmdtyView Functions
BCF_AskBCF_AskSizeBCF_BidBCF_BidSizeBCF_ChangeBCF_ChangeExtBCF_CloseBCF_ContractDateBCF_ExchangeNameBCF_ExpirationDateBCF_HighBCF_LastBCF_LastExtBCF_LastSizeBCF_LowBCF_NameBCF_OpenBCF_OpenInterestBCF_PercChgExtBCF_Percent ChangeBCF_PreviousBCF_PrevSettleBCF_SettleBCF_SizexAskBCF_SizexBidBCF_SymbolBCF_SymbolDescriptionBCF_TickDirectionBCF_TimestampBCF_UnderlyingFutureBCF_VolumeBCF_VolumeTimestampBCH Historical Date Function
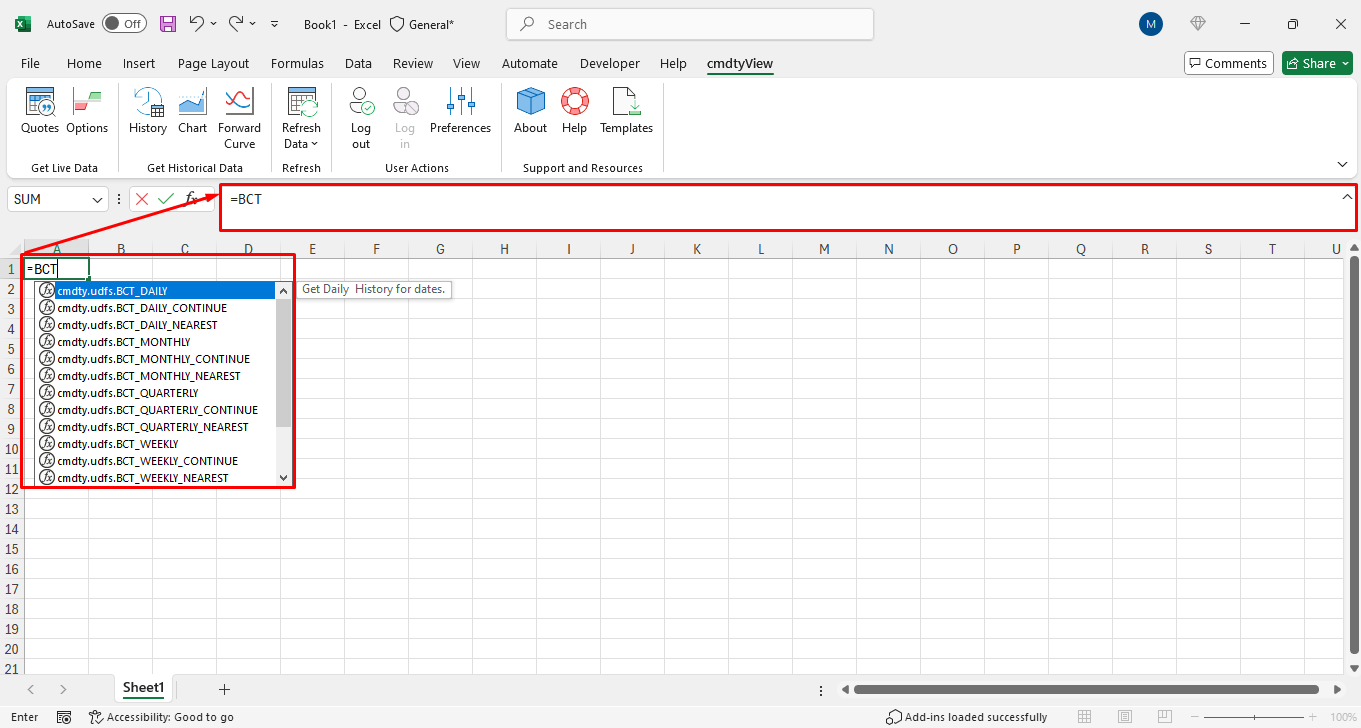
Using the =BCH function, daily, weekly, monthly, quarterly and yearly historical data as of a specific date can be called directly into a single cell in your Excel spreadsheet. When keying in =BCH, you will see a list of available historical date functions.
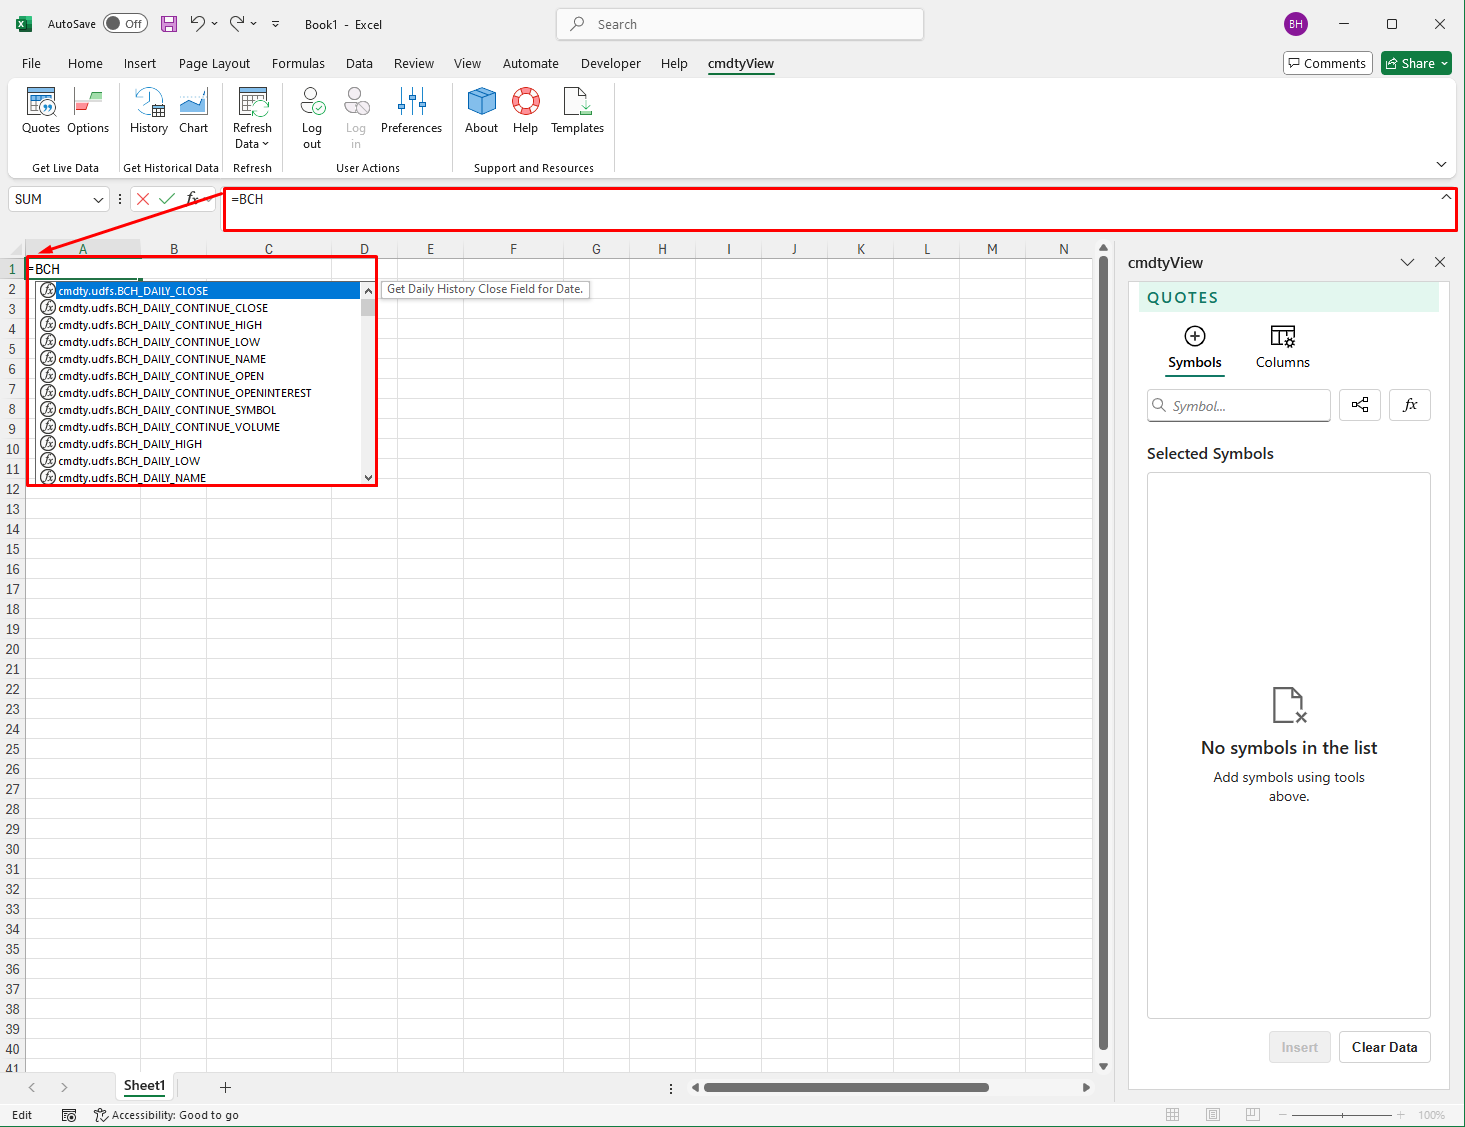
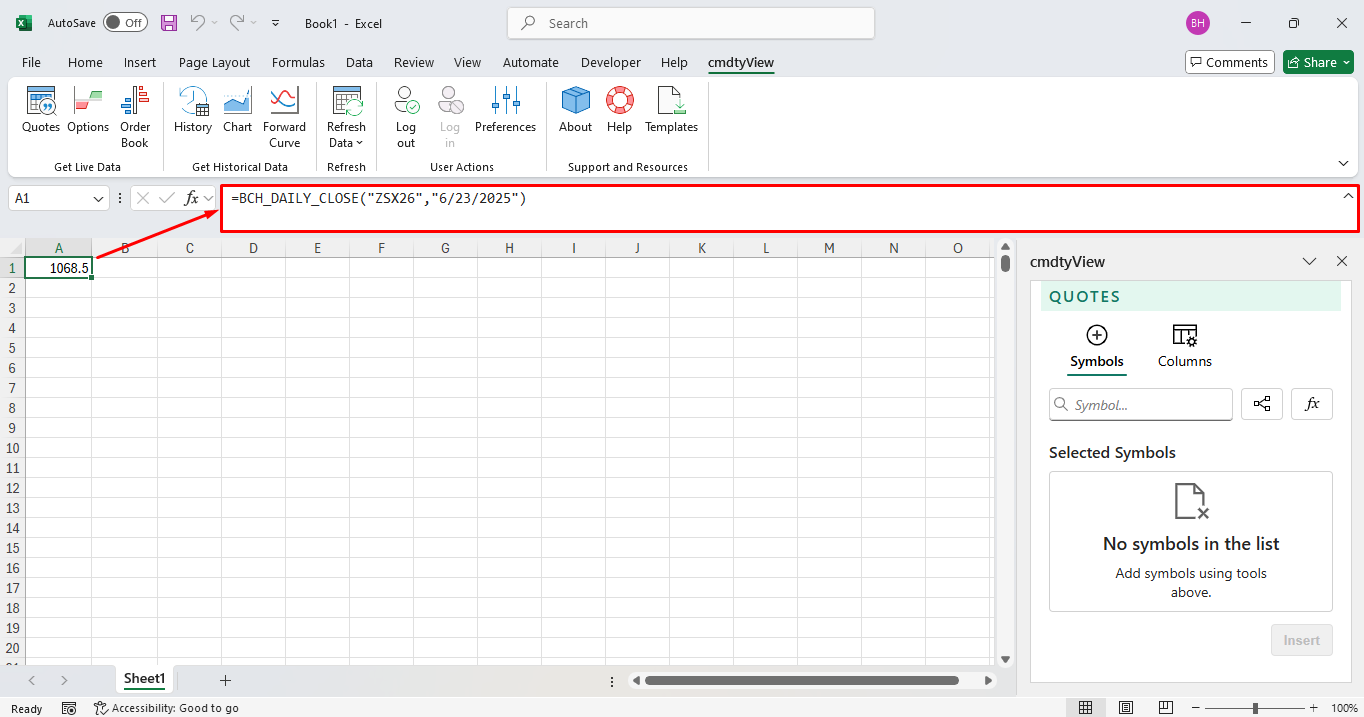
Historical data can be entered into the cell via absolute values or cell reference. For absolute values, similar to the =BCF function, after selecting the required function you will need to enter in the symbol and a date.
=BCH_Daily_Close(“Symbol”,”Date”)

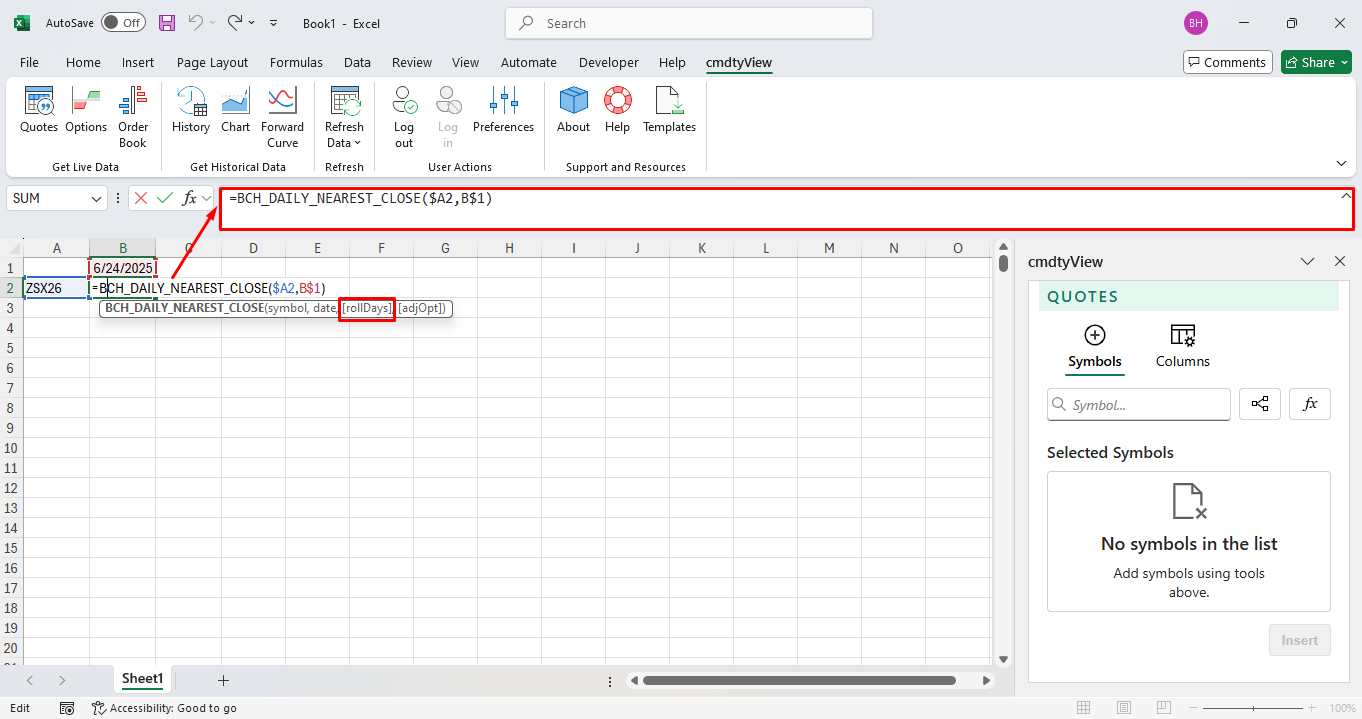
For cell reference, in the below image, A2 contains the symbol and B1 contains the field. The absolute reference is B2.

Single symbol and multiple dates can be inserted by locking the rows and columns. The single symbol with multiple date reference in B2 is =BCH_Daily_Close($A2,B$1). The $ locks the columns and rows which enables you to drag and copy the formula across multiple rows. Once finished dragging, the cell(s) will automatically update with that fields value.

The same logic as above holds true for multiple symbols and one date. The multiple symbol and single field reference in B2 is =BCH_Daily_Close($A2,B$1) again. Now you can click and drag the formula to the other symbols cells. Once finished dragging, the cell(s) will automatically update with that fields value.

(Note: Using weekly and higher aggregations will require the correct start date to properly pull in the data. Example, for last week’s weekly close, Monday’s date will have to be entered)
Futures data as of a date can be adjusted for both the ‘nearest’ and ‘continue’ aggregations based on roll options: days to expiration and volume and open interest.
To view historical data where the underlying future rolled on expiration, enter in ‘0’. To roll the historical data based on a date prior to expiration, enter in a days to expiration value. Leave this argument blank to roll based on a combination of volume and open interest.
BCH Date Function Document
Below is a text document that contains all of the cmdtyView for Excel Historical date functions. Copy and paste any of the functions into Excel (with a ‘equals sign’ prefix) to quickly pull in data into your spreadsheet.
cmdtyView Excel Historical
BCH_Daily_Continue_CloseBCH_Daily_Continue_HighBCH_Daily_Continue_LowBCH_Daily_Continue_NameBCH_Daily_Continue_OpenBCH_Daily_Continue_OpenInterestBCH_Daily_Continue_SymbolBCH_Daily_Continue_VolumeBCH_Daily_Nearest_CloseBCH_Daily_Nearest_HighBCH_Daily_Nearest_LowBCH_Daily_Nearest_NameBCH_Daily_Nearest_OpenBCH_Daily_Nearest_OpenInterestBCH_Daily_Nearest_SymbolBCH_Daily_Nearest_VolumeBCH_Daily_CloseBCH_Daily_HighBCH_Daily_LowBCH_Daily_NameBCH_Daily_OpenBCH_Daily_OpenInterestBCH_Daily_SymbolBCH_Daily_VolumeBCH_Monthly_Continue_CloseBCH_Monthly_Continue_HighBCH_Monthly_Continue_LowBCH_Monthly_Continue_NameBCH_Monthly_Continue_OpenBCH_Monthly_Continue_OpenInterestBCH_Monthly_Continue_SymbolBCH_Monthly_Continue_VolumeBCH_Monthly_Nearest_CloseBCH_Monthly_Nearest_HighBCH_Monthly_Nearest_LowBCH_Monthly_Nearest_NameBCH_Monthly_Nearest_OpenBCH_Monthly_Nearest_OpenInterestBCH_Monthly_Nearest_SymbolBCH_Monthly_Nearest_VolumeBCH_Monthly_CloseBCH_Monthly_HighBCH_Monthly_LowBCH_Monthly_NameBCH_Monthly_OpenBCH_Monthly_OpenInterestBCH_Monthly_SymbolBCH_Monthly_VolumeBCH_Quarterly_Continue_CloseBCH_Quarterly_Continue_HighBCH_Quarterly_Continue_LowBCH_Quarterly_Continue_NameBCH_Quarterly_Continue_OpenBCH_Quarterly_Continue_OpenInterestBCH_Quarterly_Continue_SymbolBCH_Quarterly_Continue_VolumeBCH_Quarterly_Nearest_CloseBCH_Quarterly_Nearest_HighBCH_Quarterly_Nearest_LowBCH_Quarterly_Nearest_NameBCH_Quarterly_Nearest_OpenBCH_Quarterly_Nearest_OpenInterestBCH_Quarterly_Nearest_SymbolBCH_Quarterly_Nearest_VolumeBCH_Quarterly_CloseBCH_Quarterly_HighBCH_Quarterly_LowBCH_Quarterly_NameBCH_Quarterly_OpenBCH_Quarterly_OpenInterestBCH_Quarterly_SymbolBCH_Quarterly_VolumeBCH_Weekly_Continue_CloseBCH_Weekly_Continue_HighBCH_Weekly_Continue_LowBCH_Weekly_Continue_NameBCH_Weekly_Continue_OpenBCH_Weekly_Continue_OpenInterestBCH_Weekly_Continue_SymbolBCH_Weekly_Continue_VolumeBCH_Weekly_Nearest_CloseBCH_Weekly_Nearest_HighBCH_Weekly_Nearest_LowBCH_Weekly_Nearest_NameBCH_Weekly_Nearest_OpenBCH_Weekly_Nearest_OpenInterestBCH_Weekly_Nearest_SymbolBCH_Weekly_Nearest_VolumeBCH_Weekly_CloseBCH_Weekly_HighBCH_Weekly_LowBCH_Weekly_NameBCH_Weekly_OpenBCH_Weekly_OpenInterestBCH_Weekly_SymbolBCH_Weekly_VolumeBCH_Yearly_Continue_CloseBCH_Yearly_Continue_HighBCH_Yearly_Continue_LowBCH_Yearly_Continue_NameBCH_Yearly_Continue_OpenBCH_Yearly_Continue_OpenInterestBCH_Yearly_Continue_SymbolBCH_Yearly_Continue_VolumeBCH_Yearly_Nearest_CloseBCH_Yearly_Nearest_HighBCH_Yearly_Nearest_LowBCH_Yearly_Nearest_NameBCH_Yearly_Nearest_OpenBCH_Yearly_Nearest_OpenInterestBCH_Yearly_Nearest_SymbolBCH_Yearly_Nearest_VolumeBCH_Yearly_CloseBCH_Yearly_HighBCH_Yearly_LowBCH_Yearly_NameBCH_Yearly_OpenBCH_Yearly_OpenInterestBCH_Yearly_SymbolBCH_Yearly_VolumeBCT Historical Time Series Functions
Similar in syntax to the =BCH historical date function, historical time series data can be called directly into an Excel spreadsheet using the =BCT cmdtyView for Excel function. Tick, intraday, Daily, weekly, monthly, quarterly and yearly historical time series data can be queried with the =BET function.
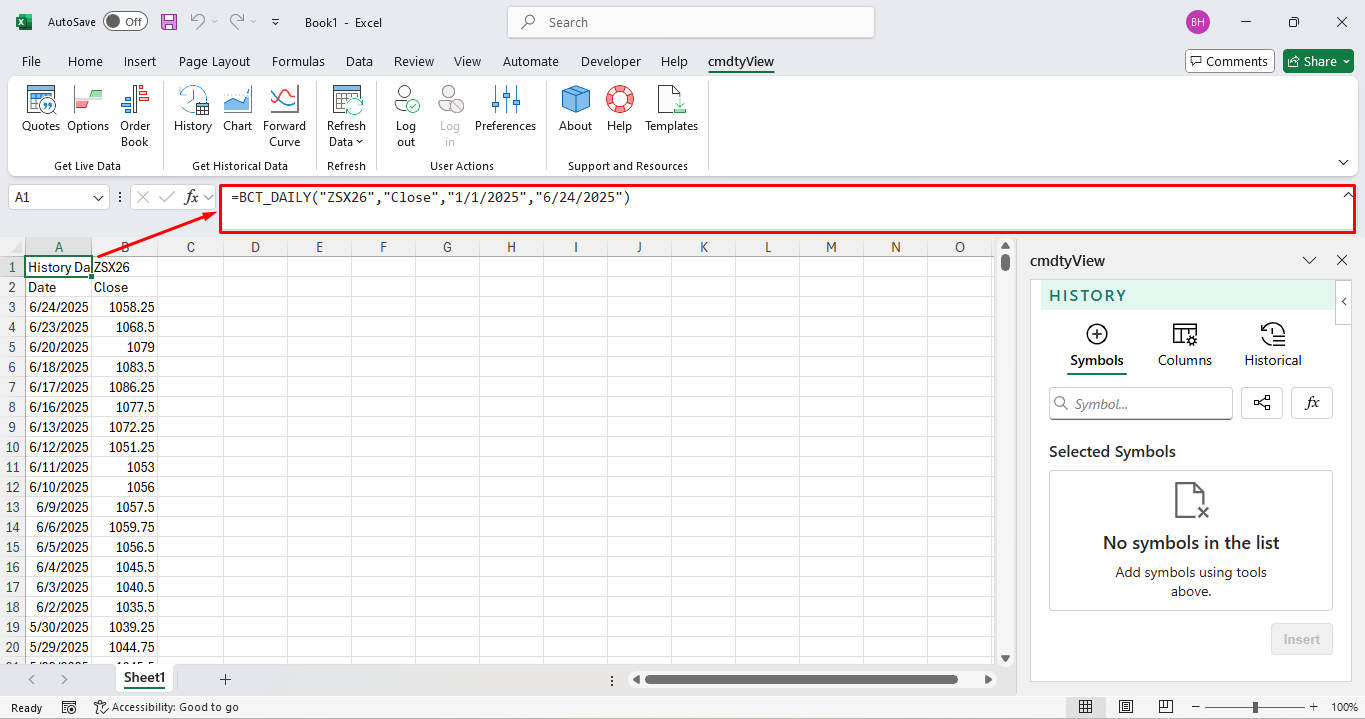
Historical data can be entered into the cell via absolute values or cell reference. For absolute values, similar to the =BCH function, after selecting the required function you will need to enter in the symbol, field, start date and end date.
=BCT_Daily(“Symbol”,”Field”,”Start Date”,”End Date”)
(Note: Expressions are supported when using the BCT historical time series function)
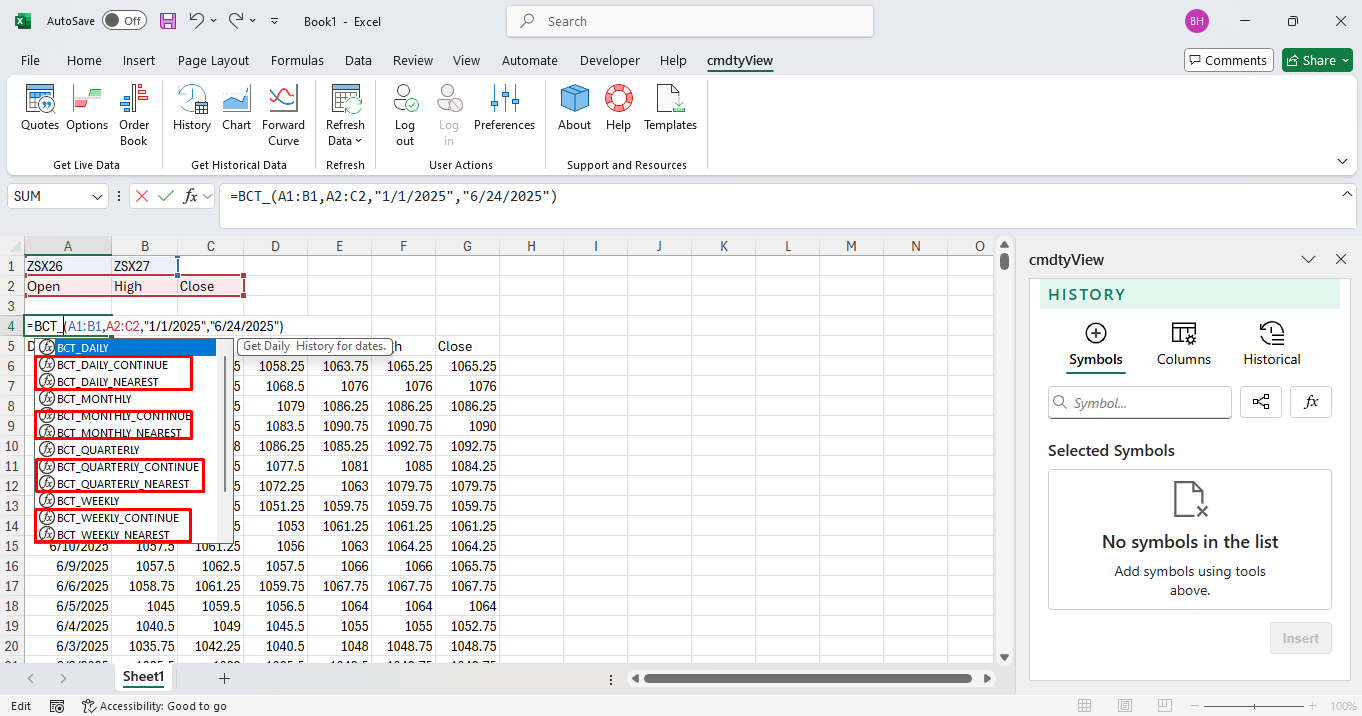
For cell reference, multiple symbols and multiple fields can inserted using a range of cells. In the image below, the symbol range is A1:C1.
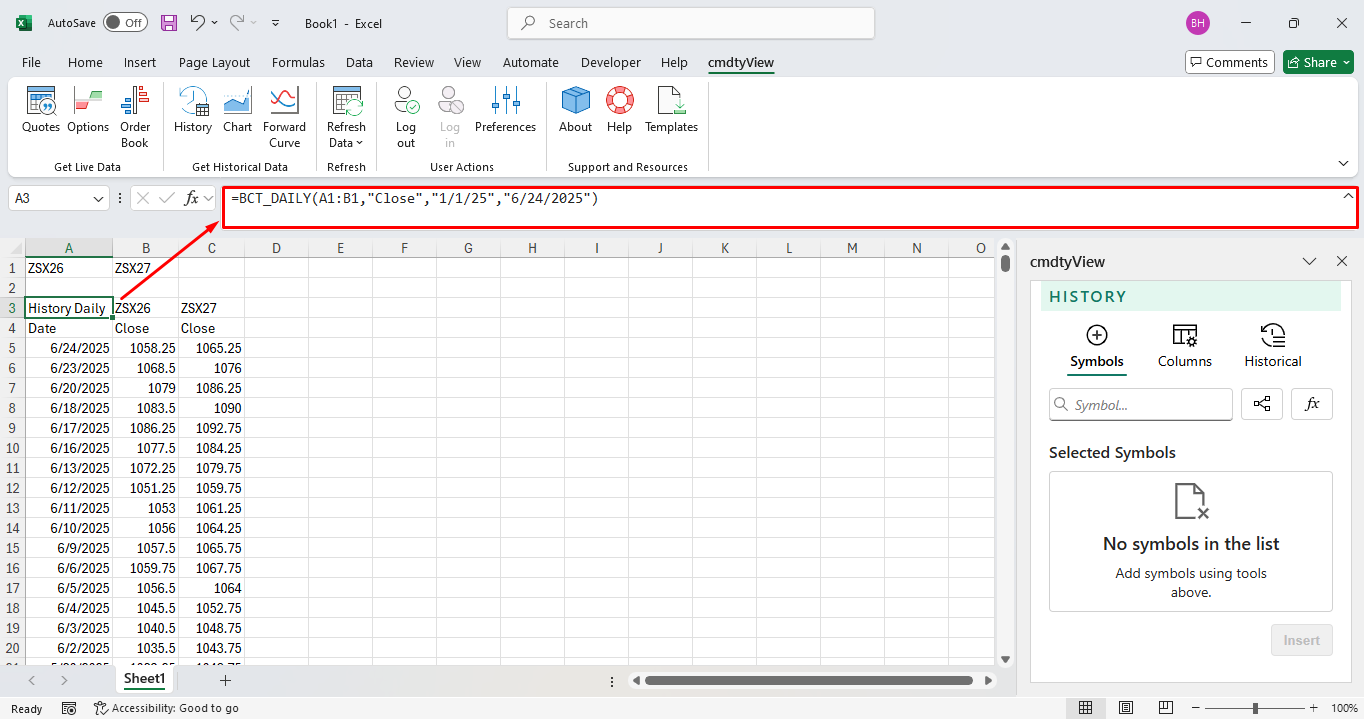
After the symbol range is selected, a field range can be selected. Below the field range is A2:E2.

After the symbol and field ranges are selected, enter in the start date and end date. Once the parenthesis are closed, hit enter the time series data will populate in the spreadsheet.
Historical ‘rolling’ futures data is also available through either of the nearest or continuation aggregations found in the =BCT dropdown menu.
After selecting the desired aggregation enter in the various arguments and then customize the roll options argument.
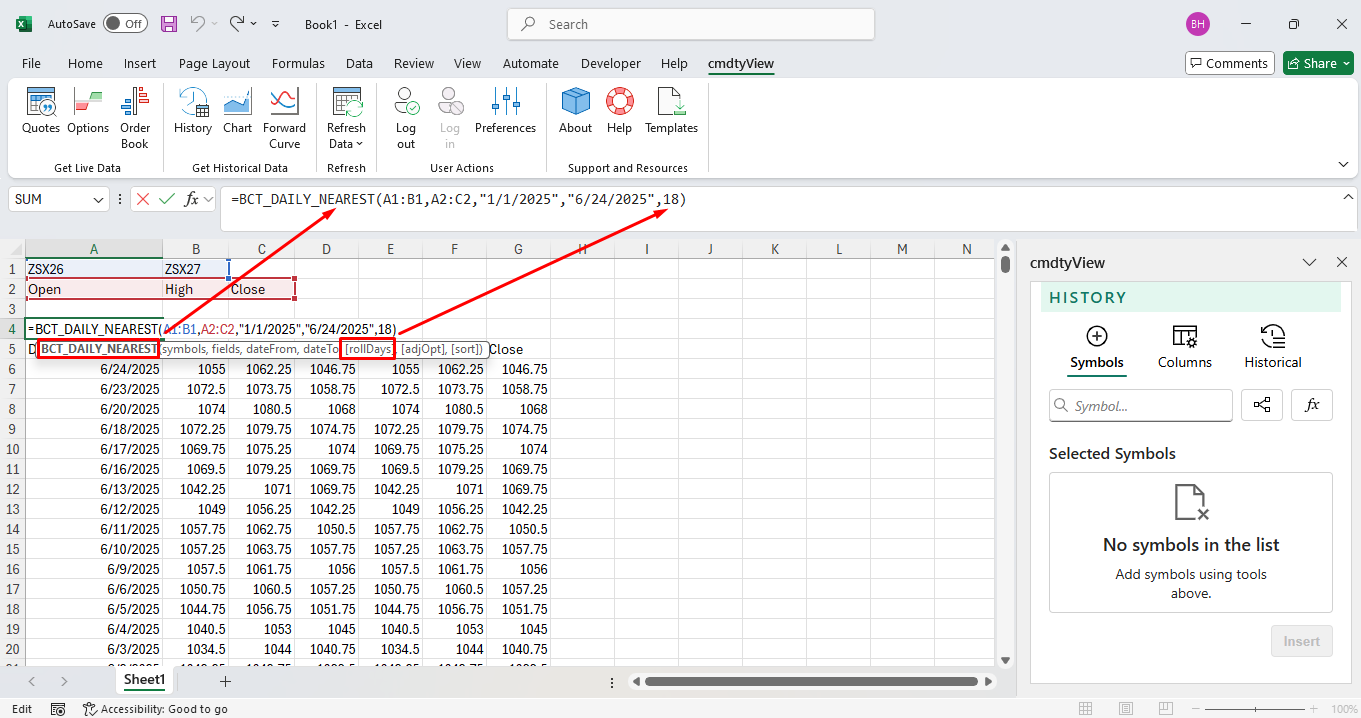
To roll the contract forward on the current contract’s expiration, enter in ‘0’. To roll the current contract forward on a date prior to expiration, enter in a days to expiration value. Leave this argument blank to roll forward based on combination of volume and open interest.
Historical data by default is returned in descending order, using the Sort argument at the end of the string, data can be returned in ascending order using an “A”.
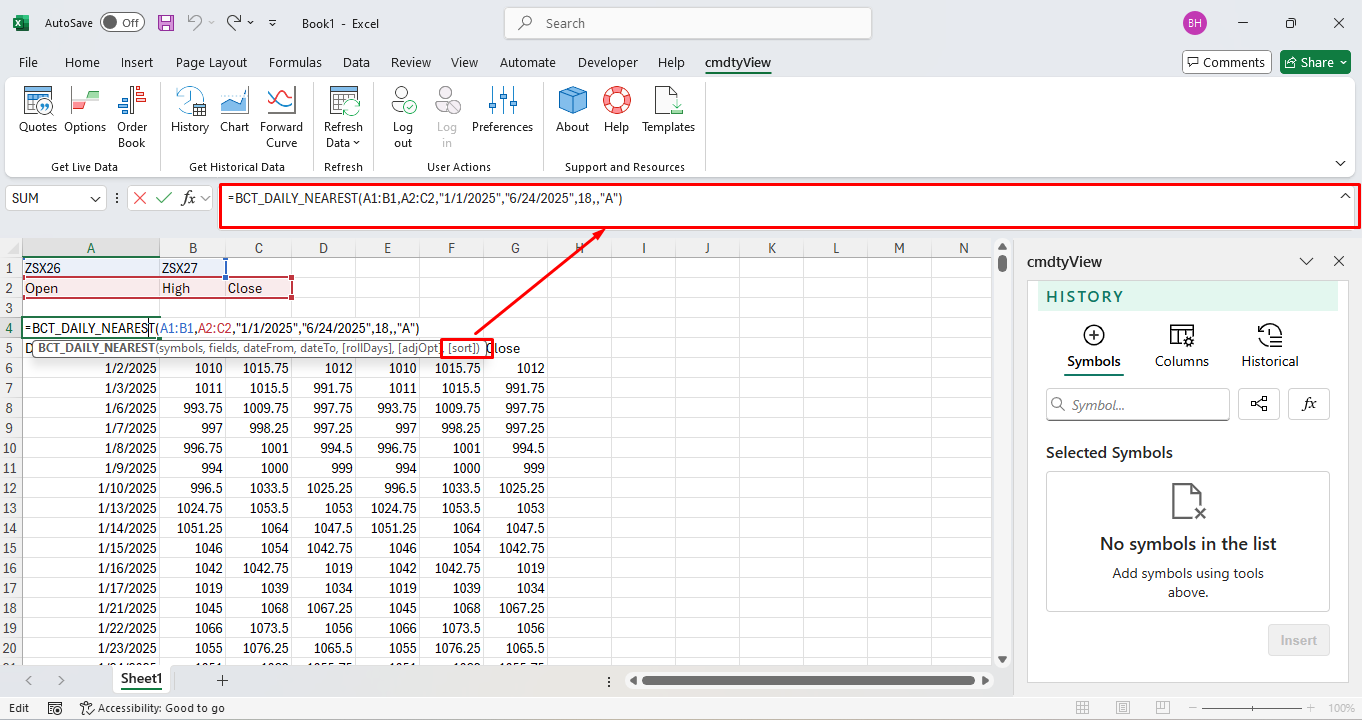
Below is a sample query for unadjusted ZC*0 data sorted in ascending order:
=BCT_Daily(“ZC*0”,“Close”,“1/1/2024”,“2/7/2024”,,“A”)
BCS Historical Study Functions
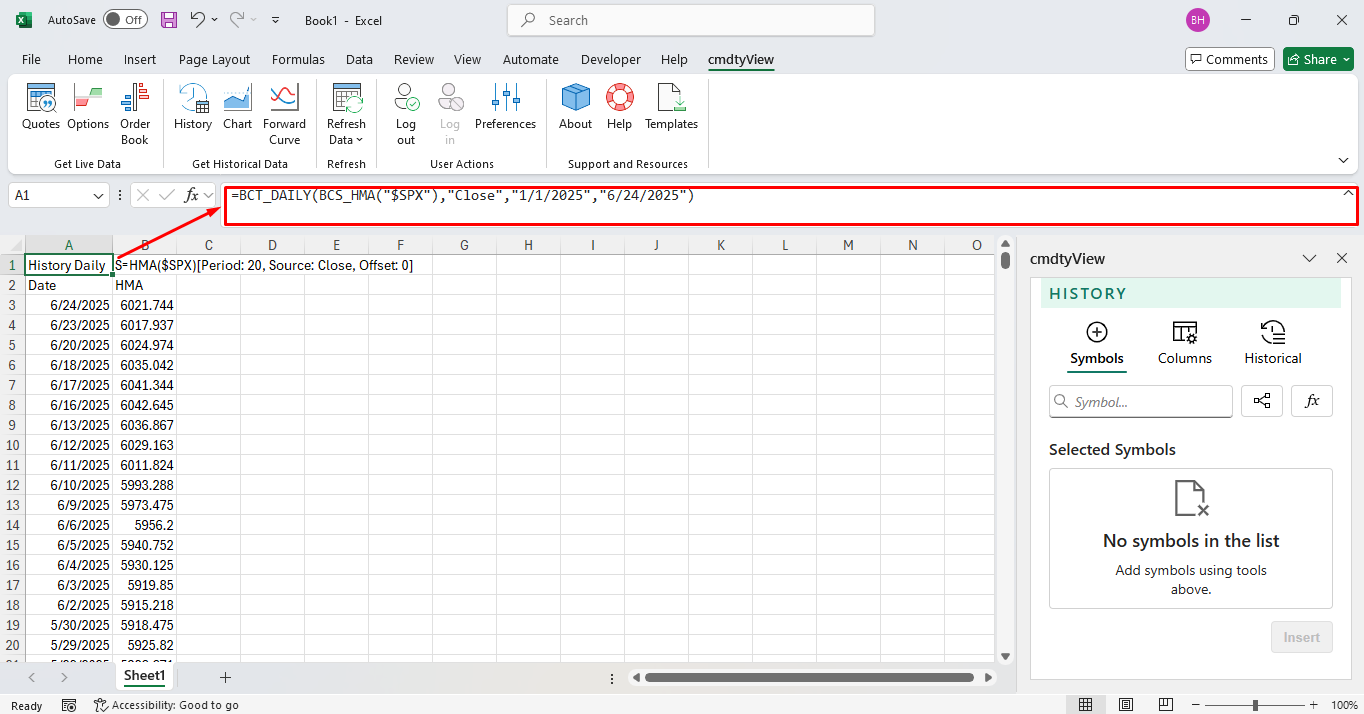
Historical study data can be called directly into a cell or spreadsheet via the BCS function. When prompted to enter the symbol argument for the =BCH or =BCT function, entering in BCS will populate a list of technical indicators.

After selecting a study, enter in the symbol and the study periods / parameters. Once the study is customized, enclose the study data and continue entering the next arguments of the BCH or BCT function. For historical study data as of a date, use the =BCH and BCS functions together. Below is the S&P 500’s ($SPX) 20 day Hull Moving Average on from 1/1/2025 to 6/24/2025.
When calling historical study data as of a date via the =BEH function, you will need to specify the study’s output to be queried. In the example below, the S&P 500 ($SPX) 20-day Moving Average is queried for end of day on 6/24/2025.
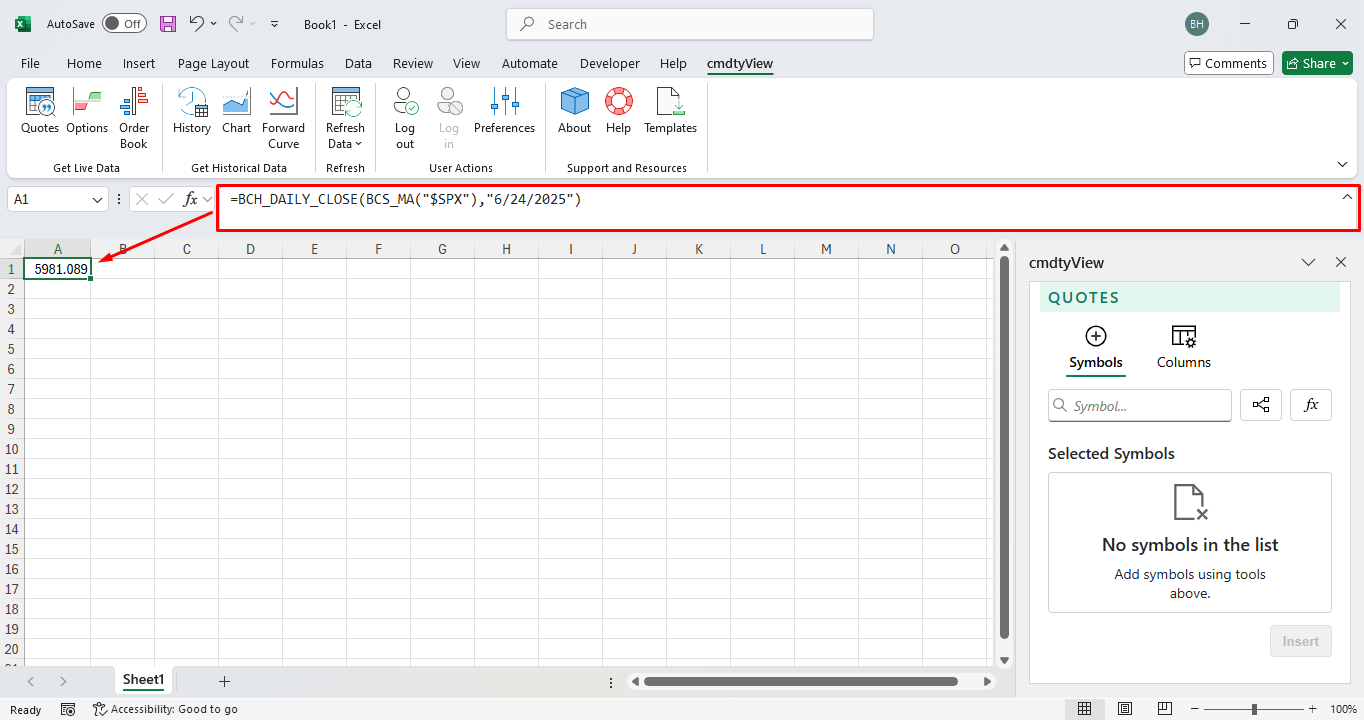
=BCH_DAILY_CLOSE(BCS_MA(“$SPX”),“6/24/2025”)
(Note: leaving the Period / Parameters blank will pull in the study’s default values)
BCS Study Function Documents
Below is a text document that contains all of the cmdtyView for Excel study functions. Copy and paste any of the functions into Excel to quickly pull in data into your spreadsheet.
Studies
MA - Moving AverageCSHO - Cash OverlayCSHB - Cash BasisMAVOL - Volume Moving AverageOSCI - OscillatorOSCIVOL - Volume OscillatorMAENV - Moving Average EnvelopeLINRCHN - Linear Regression ChannelMAENVEXP - Moving Average Envelope ExponentialMAENVSMO - Moving Average Envelope SmoothedMAEXP - Moving Average ExponentialMASMO - Moving Average SmoothedMATRI - Moving Average TriangularMAWEI - Moving Average WeightedMAHLC - Moving Average High/LowMACD - MACD OscillatorMACDEXP - MACD Oscillator ExponentialVOL - VolumeOPINT - Open InterestRSI - Relative Strength IndexRSIMOD - Relative Strength Index ModifiedRSISTO - Stochastic RSIHHLL - Highest High Lowest LowWGCL - Weighted CloseWPERCR - Percent RSTOCHF - Stochastic, FastSTOCHS - Stochastic, SlowBBANDS - Bollinger BandsBWIDTH - Bollinger WidthBPERC - Bollinger Bands %BOBVOL - On Balance VolumeATR - Average True RangeADJATR - Average True Range AdjustedCOTR - Change over True RangeADX - Average Directional IndexADXMOD - Average Directional Index ModifiedADL - Chaikin Accumulation DistributionADWM - Accumulation/Distribution WilliamsCHAOSC - Chaikin OscillatorTP - Typical PriceKELCHN - Keltner ChannelKELEXP - Keltner Channel ExponentialKELBND - Keltner BandsDONCHN - Donchian ChannelDONWIDTH - Donchian WidthPVT - Price Volume TrendROC - Rate Of ChangeTRIX - Triple ExponentialDEMA - Moving Average Exponential 2XTEMA - Moving Average Exponential 3XTSI - True Strength IndexPPMOV - Pivot Points BandsARNUPDW - Aroon Up/DownARNOSC - Aroon OscillatorTCHN - Turtle ChannelTCHRE - Turtle Channel RetracementALLG - AlligatorPLTLN - Plot LineAWEOSC - Awesome OscillatorCLV - Close Location ValueCHAMF - Chaikin Money FlowCHAVOL - Chaikin VolatilityDPO - Detrended Price OscillatorMCGD - McGinley DynamicHMA - Hull Moving AverageCOPP - Coppock CurveCCI - Commodity Channel IndexEMV - Ease Of MovementERBLPOW - Elder Ray Bull PowerERBRPOW - Elder Ray Bear PowerFI - Force IndexMI - Mass IndexMOM - MomentumMFI - Money Flow IndexMSD - Moving Standard DeviationPCTCHG - Percent ChangeNVI - Negative Volume IndexPVI - Positive Volume IndexPPO - Percentage Price OscillatorPVO - Percentage Volume OscillatorHV - Historical VolatilityPERF - Price PerformanceWASI - Wilder Accumulative Swing IndexWWVOL - Welles Wilder VolatilityPARTP - Parabolic Time/Price (SAR)REATRHI - Retracement ATR HighREATRLO - Retracement ATR LowMOVLR - Moving Linear RegressionTRSP - TrendSpotterCOTLC - Commitment of TradersCOTDAG - Commitment of Traders DisaggregatedCOTFTR - Commitment of Traders FinancialPIVPTS - Pivot PointsCPP - Camarilla Pivot PointsIMPVOL - Implied Volatility (Futures)CTM - Cycle Trading MomentumGPMI - GBE Principal Momentum IndicatorGTPI - GBE Turning Point IndicatorGMMA - Guppy Multiple Moving AverageSTOMOMIX - Stochastic Momentum IndexCHDMOMOSC - Chande Momentum OscillatorVSTOP - Volatility StopSUPTR - SupertrendICHCLD - Ichimoku CloudsVWAP - VWAPMACDSIG - MA vs MA Buy/Sell SignalMASIG - Close vs MA Buy/Sell SignalVOIN - Vortex IndicatorDIFA - Distance From AverageDOSC - Derivative OscillatorBSQUEEZE - Bollinger Bands SqueezeMARIB - Moving Average RibbonHASMO - Heikin-Ashi SmoothedTTMSQZ - TTM SqueezeBelow is a text document that contains all of the cmdtyView for Excel study outputs or fields. Copy and paste any of the functions into Excel to quickly pull in data into your spreadsheet.
Study Fields
MA - MA-SimpleVOLMA - MA-VolumeVolume - VolumeOSC - OSCENVU - Envelope-UpENVD - Envelope-DownLINRUP - LinRegUpperLINRMID - LinRegMiddleLINRLOW - LinRegLowerENVEXPU - Envelope-Exponential-UpENVEXPD - Envelope-Exponential-DownENVSMOU - Envelope-Smoothed-UpENVSMOD - Envelope-Smoothed-DownEMA - MA-ExpSMA - MA-SmoothedTMA - MA-TriangularWMA - MA-WeightedMAHI - MA-HighMALO - MA-LowMACD - MACDMACDS - MACD-SignalMACDH - MACD-HistogramMACD - MACDMACDS - MACD-SignalMACDH - MACD-HistogramVolume - VolumeOpenInterest - Open InterestOpenInterest - Open InterestRSI - RSIRSI - RSISTORSI - StochRSIHH - HighestHighLL - LowestLowWGCL - WeightedClosePercR - %RPercK - %KPercD - %DPercK - %KPercD - %DBOLLBU - Bollinger-UpperBOLLBM - Bollinger-MidBOLLBL - Bollinger-LowerBOLLBW - Bollinger-WidthBOLLBP - Bollinger-PercentOBVOL - OnBalanceVolATR - AvgTrueRangeATRMA - MA-ATRADJATR - AdjAvgTrueRangeCOTR - ChgOverTrueRangeMDI - -DIPDI - +DIADX - ADXMDI - -DIPDI - +DIADXM - ADX-ModifiedADL - AccDistADWM - AccDistWillADWMMA - AccDistWillMovAvgCHAOSC - ChaikinOscTP - TypicalPriceKCUP - KeltChan-UpKCMID - KeltChan-MidKCLOW - KeltChan-LowKCEUP - KeltChanExp-UpKCEMID - KeltChanExp-MidKCELOW - KeltChanExp-LowKBUP - KeltBands-UpKBMID - KeltBands-MidKBLOW - KeltBands-LowDONUP - Donchian-UpDONMID - Donchian-MidDONLOW - Donchian-LowDONW - Donchian-WidthPVT - PriceVolChangeROC - RateOfChangeTRIX - Triple-MA-ExpDEMA - Double EMATEMA - Triple EMATSI - True Strength IndexTSISIG - True Strength Index SignalPVPTR - PvtPt-ResistancePVPT - PivotPointPVPTS - PvtPt-SupportARNUP - Aroon-UpARNLOW - Aroon-DownARNOSC - Aroon-OsciTCHNUP - TurtleChn-UpTCHNLOW - TurtleChn-LowTCHRE - TurtleChnRetraceALJAW - Alligator-JawALTEETH - Alligator-TeethALLIPS - Alligator-LipsPLTLN - PlotLineAWOS - AwesomeOscAWOSMA - AwesomeOsc-MACLV - CloseLocationValueCHAMF - ChaikinMoneyFlowCHAVOL - ChaikinVolatilityDPO - DetrendedPriceOscMCGD - McGinleyDynHMA - HullMovAvgCOPP - CoppCurveCCI - CommodityChannelIndexEMV - EaseOfMovementEMVMA - EaseOfMovementMAERBLPOW - ElderRayBullPowERBRPOW - ElderRayBearPowFI - ForceIndexMI - MassIndexMOM - MomentumMOMMA - MA-MomentumMFI - MoneyFlowIndexMSD - MovingStdDevPCTCHG - PercentChangeNVI - NegativeVolIndexNVIEMA - NegativeVolIndexEMAPVI - PositiveVolIndexPVIEMA - PositiveVolIndexEMAPPO - PercPriceOscPPOS - PPO-SignalPPOH - PPO-HistogramPVO - PercVolOscPVOS - PVO-SignalPVOH - PVO-HistogramHV - HistVolatilityPERF - PerformanceWASI - WilderAccSwingIndexWWVSARD - WilderVolSarDownWWVSARU - WilderVolSarUpPARSARS - ParabolicSarShortPARSARL - ParabolicSarLongREATRHI - RetraceATRHighREATRLO - RetraceATRLowMOVLR - MovingLinRegressionGMMA3 - GMMA-EMA3GMMA5 - GMMA-EMA5GMMA8 - GMMA-EMA8GMMA10 - GMMA-EMA10GMMA12 - GMMA-EMA12GMMA15 - GMMA-EMA15GMMA30 - GMMA-EMA30GMMA35 - GMMA-EMA35GMMA40 - GMMA-EMA40GMMA45 - GMMA-EMA45GMMA50 - GMMA-EMA50GMMA60 - GMMA-EMA60STOMOMIX - StochMomIndexCHDMOMOSC - ChandeMomOscVSTOPUP - VolaStop-UpVSTOPLOW - VolaStop-DownSUPTR - SupertrendCONVLN - ConversionLineBASELN - BaseLineLAGGSP - LagginSpanLEADSP1 - LeadingSpanALEADSP2 - LeadingSpanBVWAP - VWAPVWAPSD1U - VWAP Stdev1 UpperVWAPSD1L - VWAP Stdev1 LowerVWAPSD2U - VWAP Stdev2 UpperVWAPSD2L - VWAP Stdev2 Lower